Plotting a 2D Array on an XY Graph
To plot X and Y data on an XY Graph, you must have an array of X data and Y data (either as separate arrays, or combined in a 2D array). These arrays must then be bundled into a Cluster.
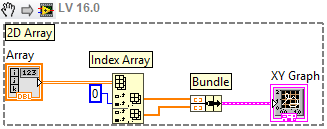
The snippet below illustrates how to index the X and Y data from a 2D array and then bundle them into a Cluster.
 Note:
Note: This image is a LabVIEW snippet, which includes LabVIEW code that you can reuse in your project. To use a snippet, right-click the image, save it to your computer, and drag the file onto your LabVIEW diagram.
- Start with your data in a two dimensional (2D) array
- Use the Index Array function to separate the array into two one-dimensional arrays -- one containing X data and one containing Y data.
- Bundle the arrays into a Cluster. This is the expected input type of the XY Graph.
Plotting Multiple Y Axes on an XY Graph
Each array of Y axis data must be bundled into a Cluster with its corresponding X axis array. Then, the Clusters (one for each Y axis) must be built into an array.
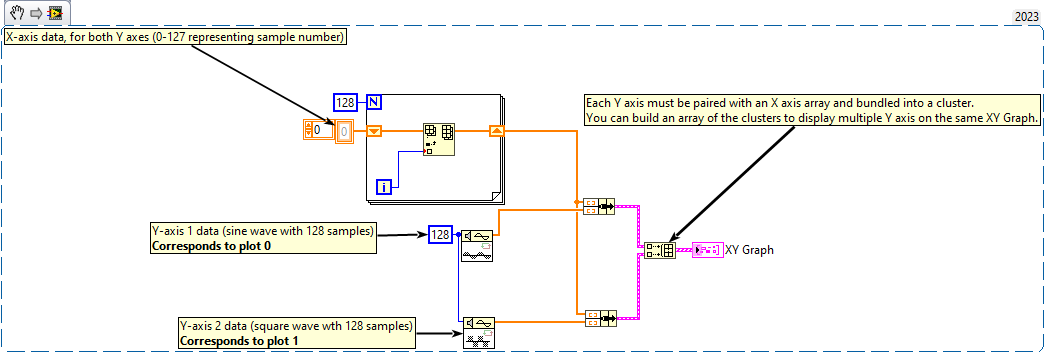
The snippet below illustrates how to plot 2 different Y axes on an XY Graph.
 Note:
Note: This image is a LabVIEW snippet, which includes LabVIEW code that you can reuse in your project. To use a snippet, right-click the image, save it to your computer, and drag the file onto your LabVIEW diagram.
- Start with an array containing the X axis data.
- In the snippet above, an array is populated with values 0 - 127, representing the sample index for the Y axes.
- Create an array containing data for the first Y axis.
- In the snippet above, a Sine Wave of 128 samples is used for Y axis 1.
- Use the Bundle function to build a Cluster of the X and Y data. Note: the X axis data must be the first element in the Cluster.
- Repeat steps 1-3 for the second Y axis.
- In the snippet above, the same X axis data is used for Y axis 2.
- Use the Build Array function to create an array of the Clusters.
Additional Information
Refer to the XY Graph Data Types VI in
C:\Program Files (x86)\National Instruments\LabVIEW <version>\examples\Controls and Indicators\Graphs and Charts\XY Graph for an example of graphing XY data.