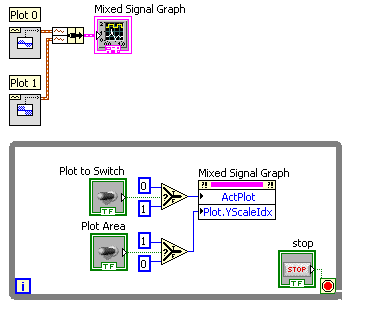
The plots are not assigned to plot areas, but are instead assigned to y-axis. Therefore, there is no Property Node that will allow you to programmatically change which plot area a given plot is displayed on.
However, if you assign a plot to any of the y-axis within a given plot area, this will cause the plot to be redrawn on the corresponding plot area, as demonstrated in the attached VI.
To do this programmatically, you will first need to set the plot you wish to change as the Active Plot, then you will need to change its Y Scale Index:
- Create a property node from the Mixed Signal Graph. On the block diagram, right click on the graph and choose Create»Property Node.
- Choose the Active Plot property.
- Drag the property node handle down so that two properties are visible. For the bottom property, choose Plot»Y Scale Index.
- Right click on the property node and select Change All To Write.
