Follow the steps below to manually generate a graph from example data, and then add a constant line to the graph:
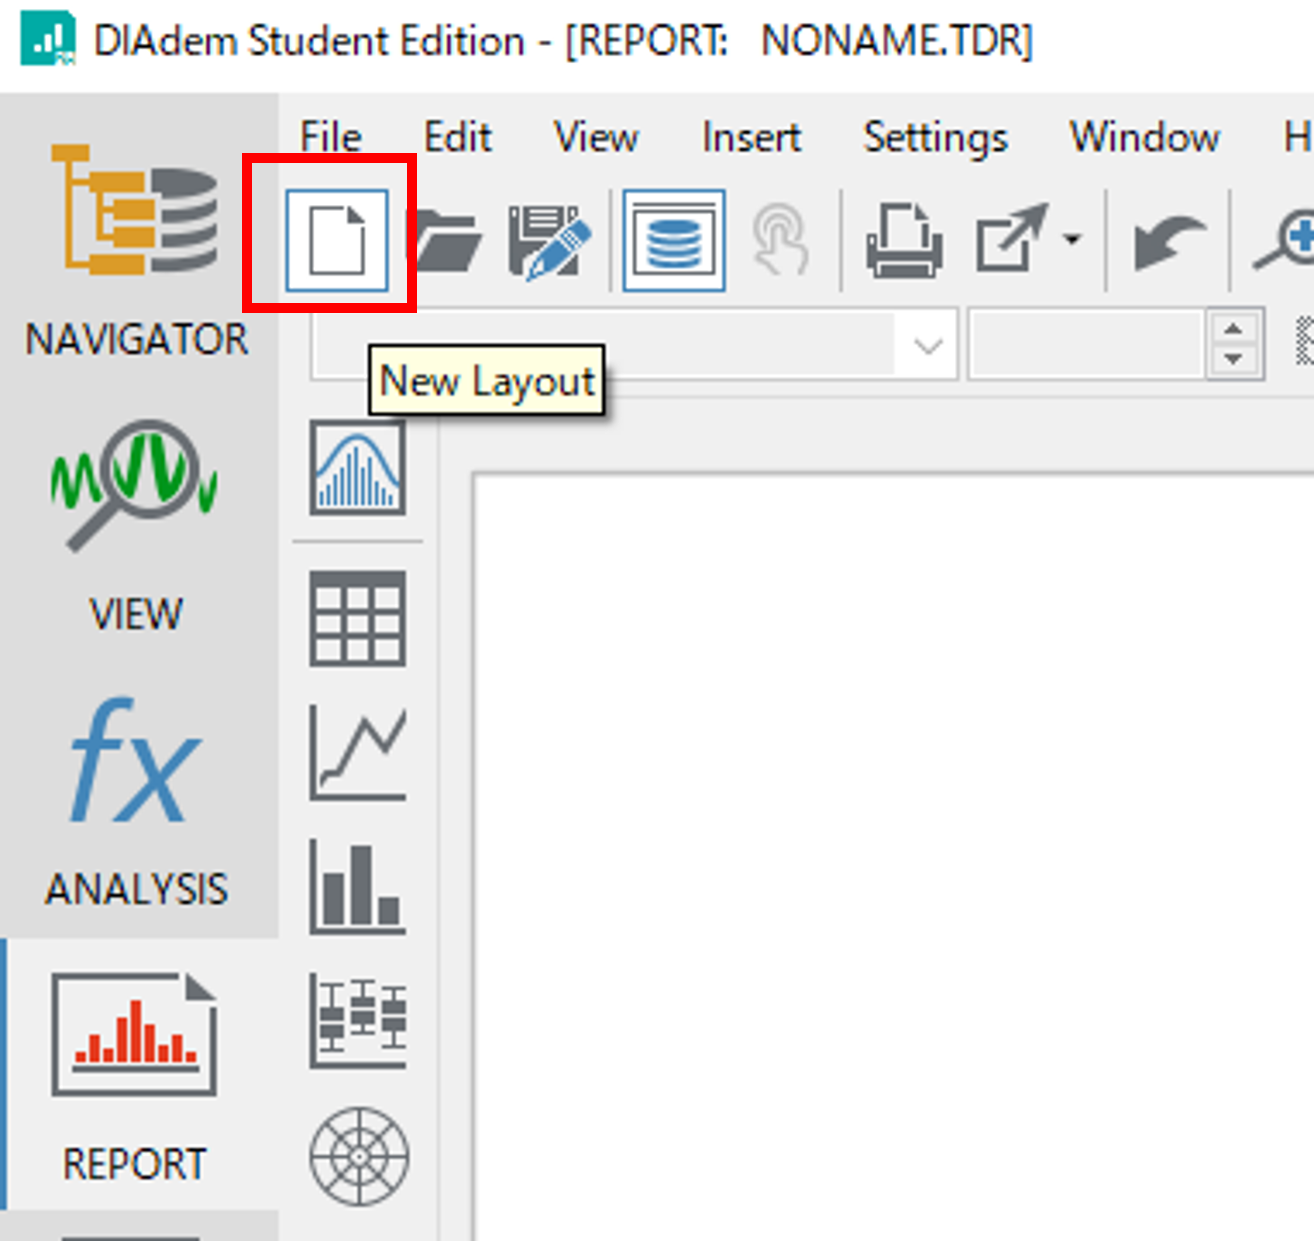
1. Go to your REPORT tab and select New Layout from the toolbar.
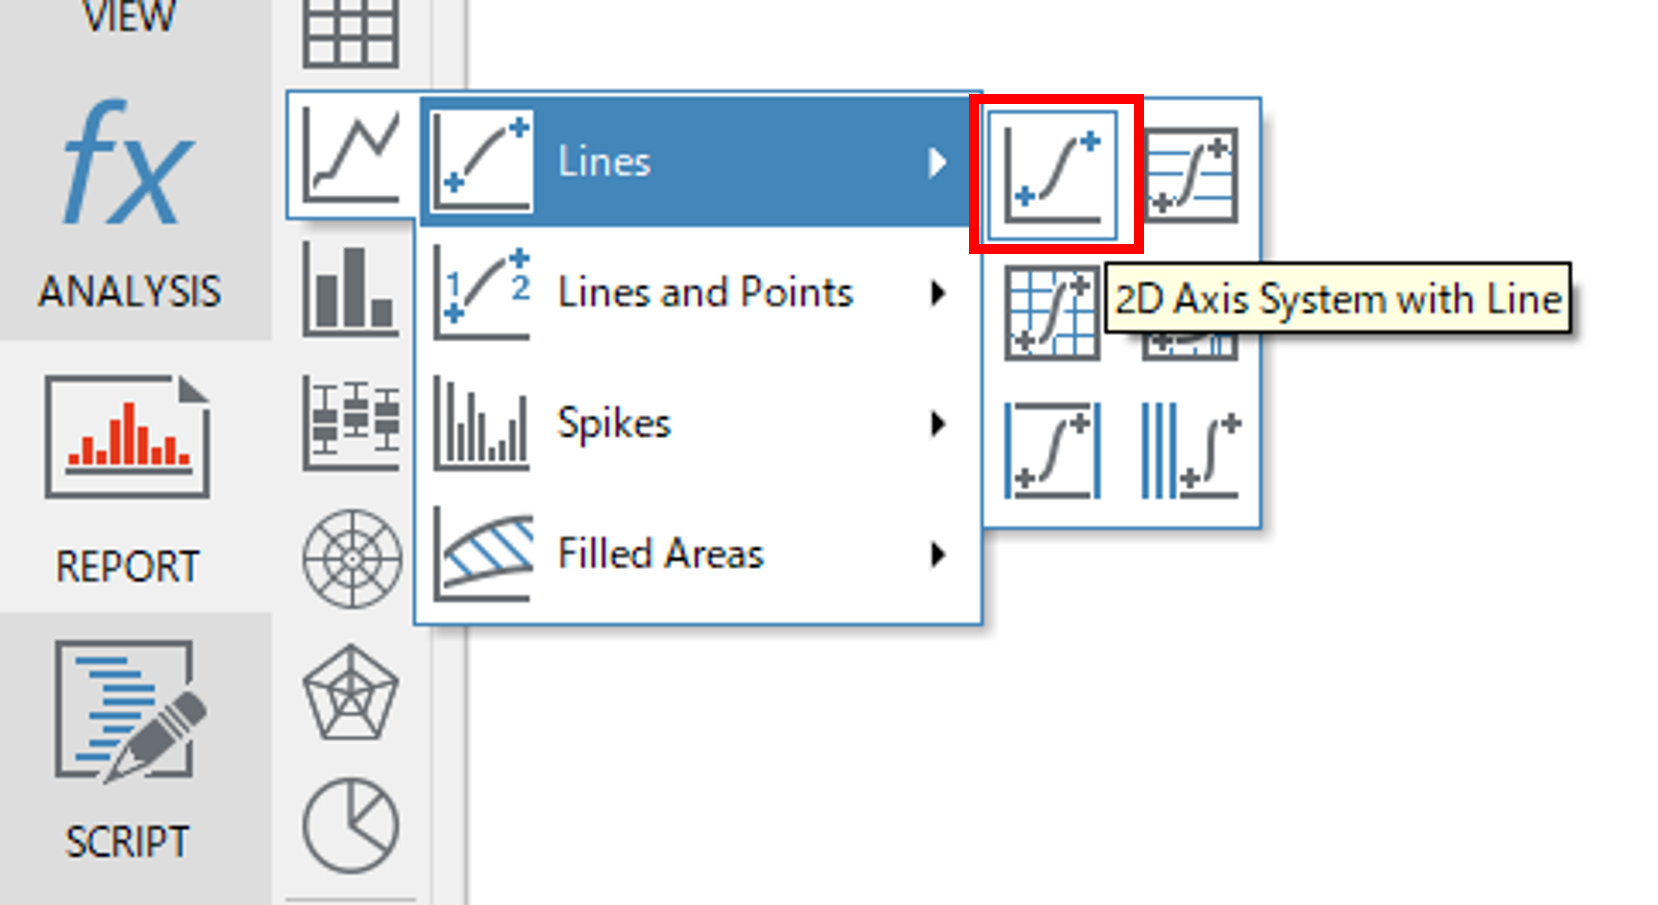
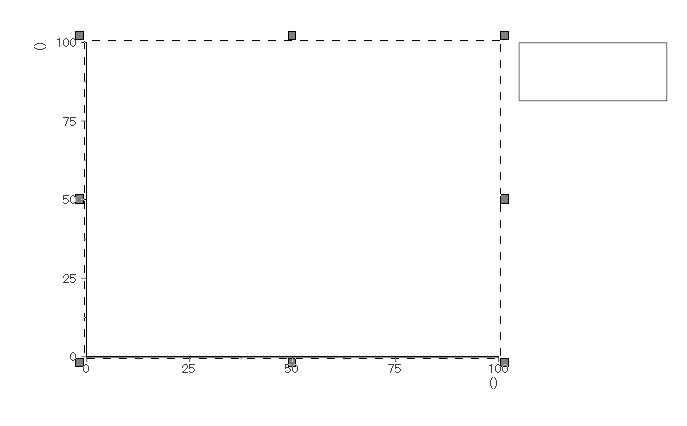
2. Add a 2D Axis System with Line to the report by clicking the 2D Line Graph icon > Lines, then clicking on the 2D Axis System with Line, then dragging your cursor into the report window.
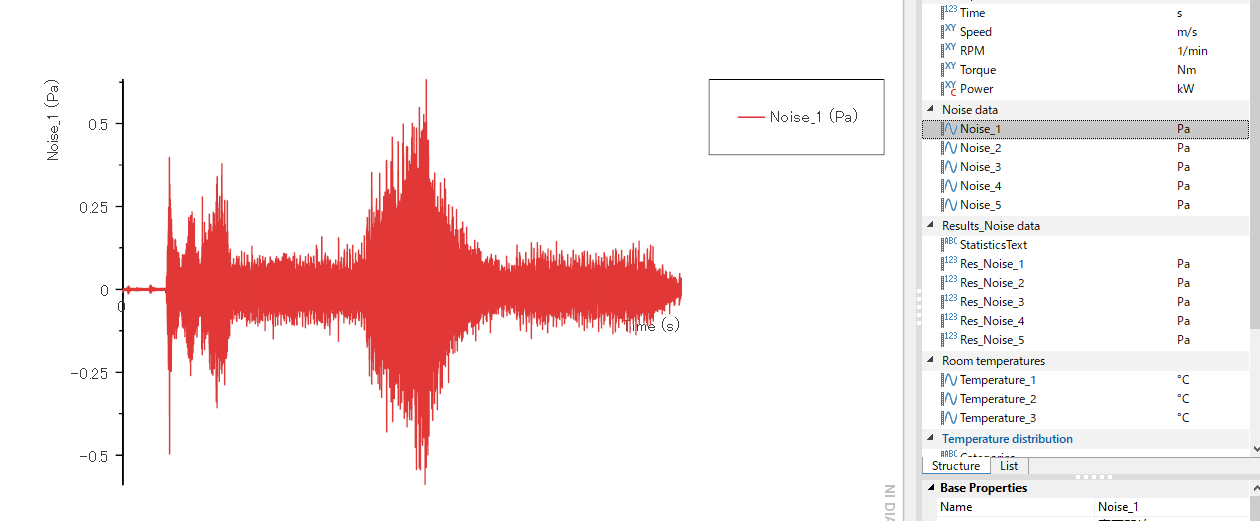
3. Open the Data Portal and select the data you would like to plot. for this example we selected Noise_1 from DIAdem's example data. Drag this data into the 2D Axis Plot.
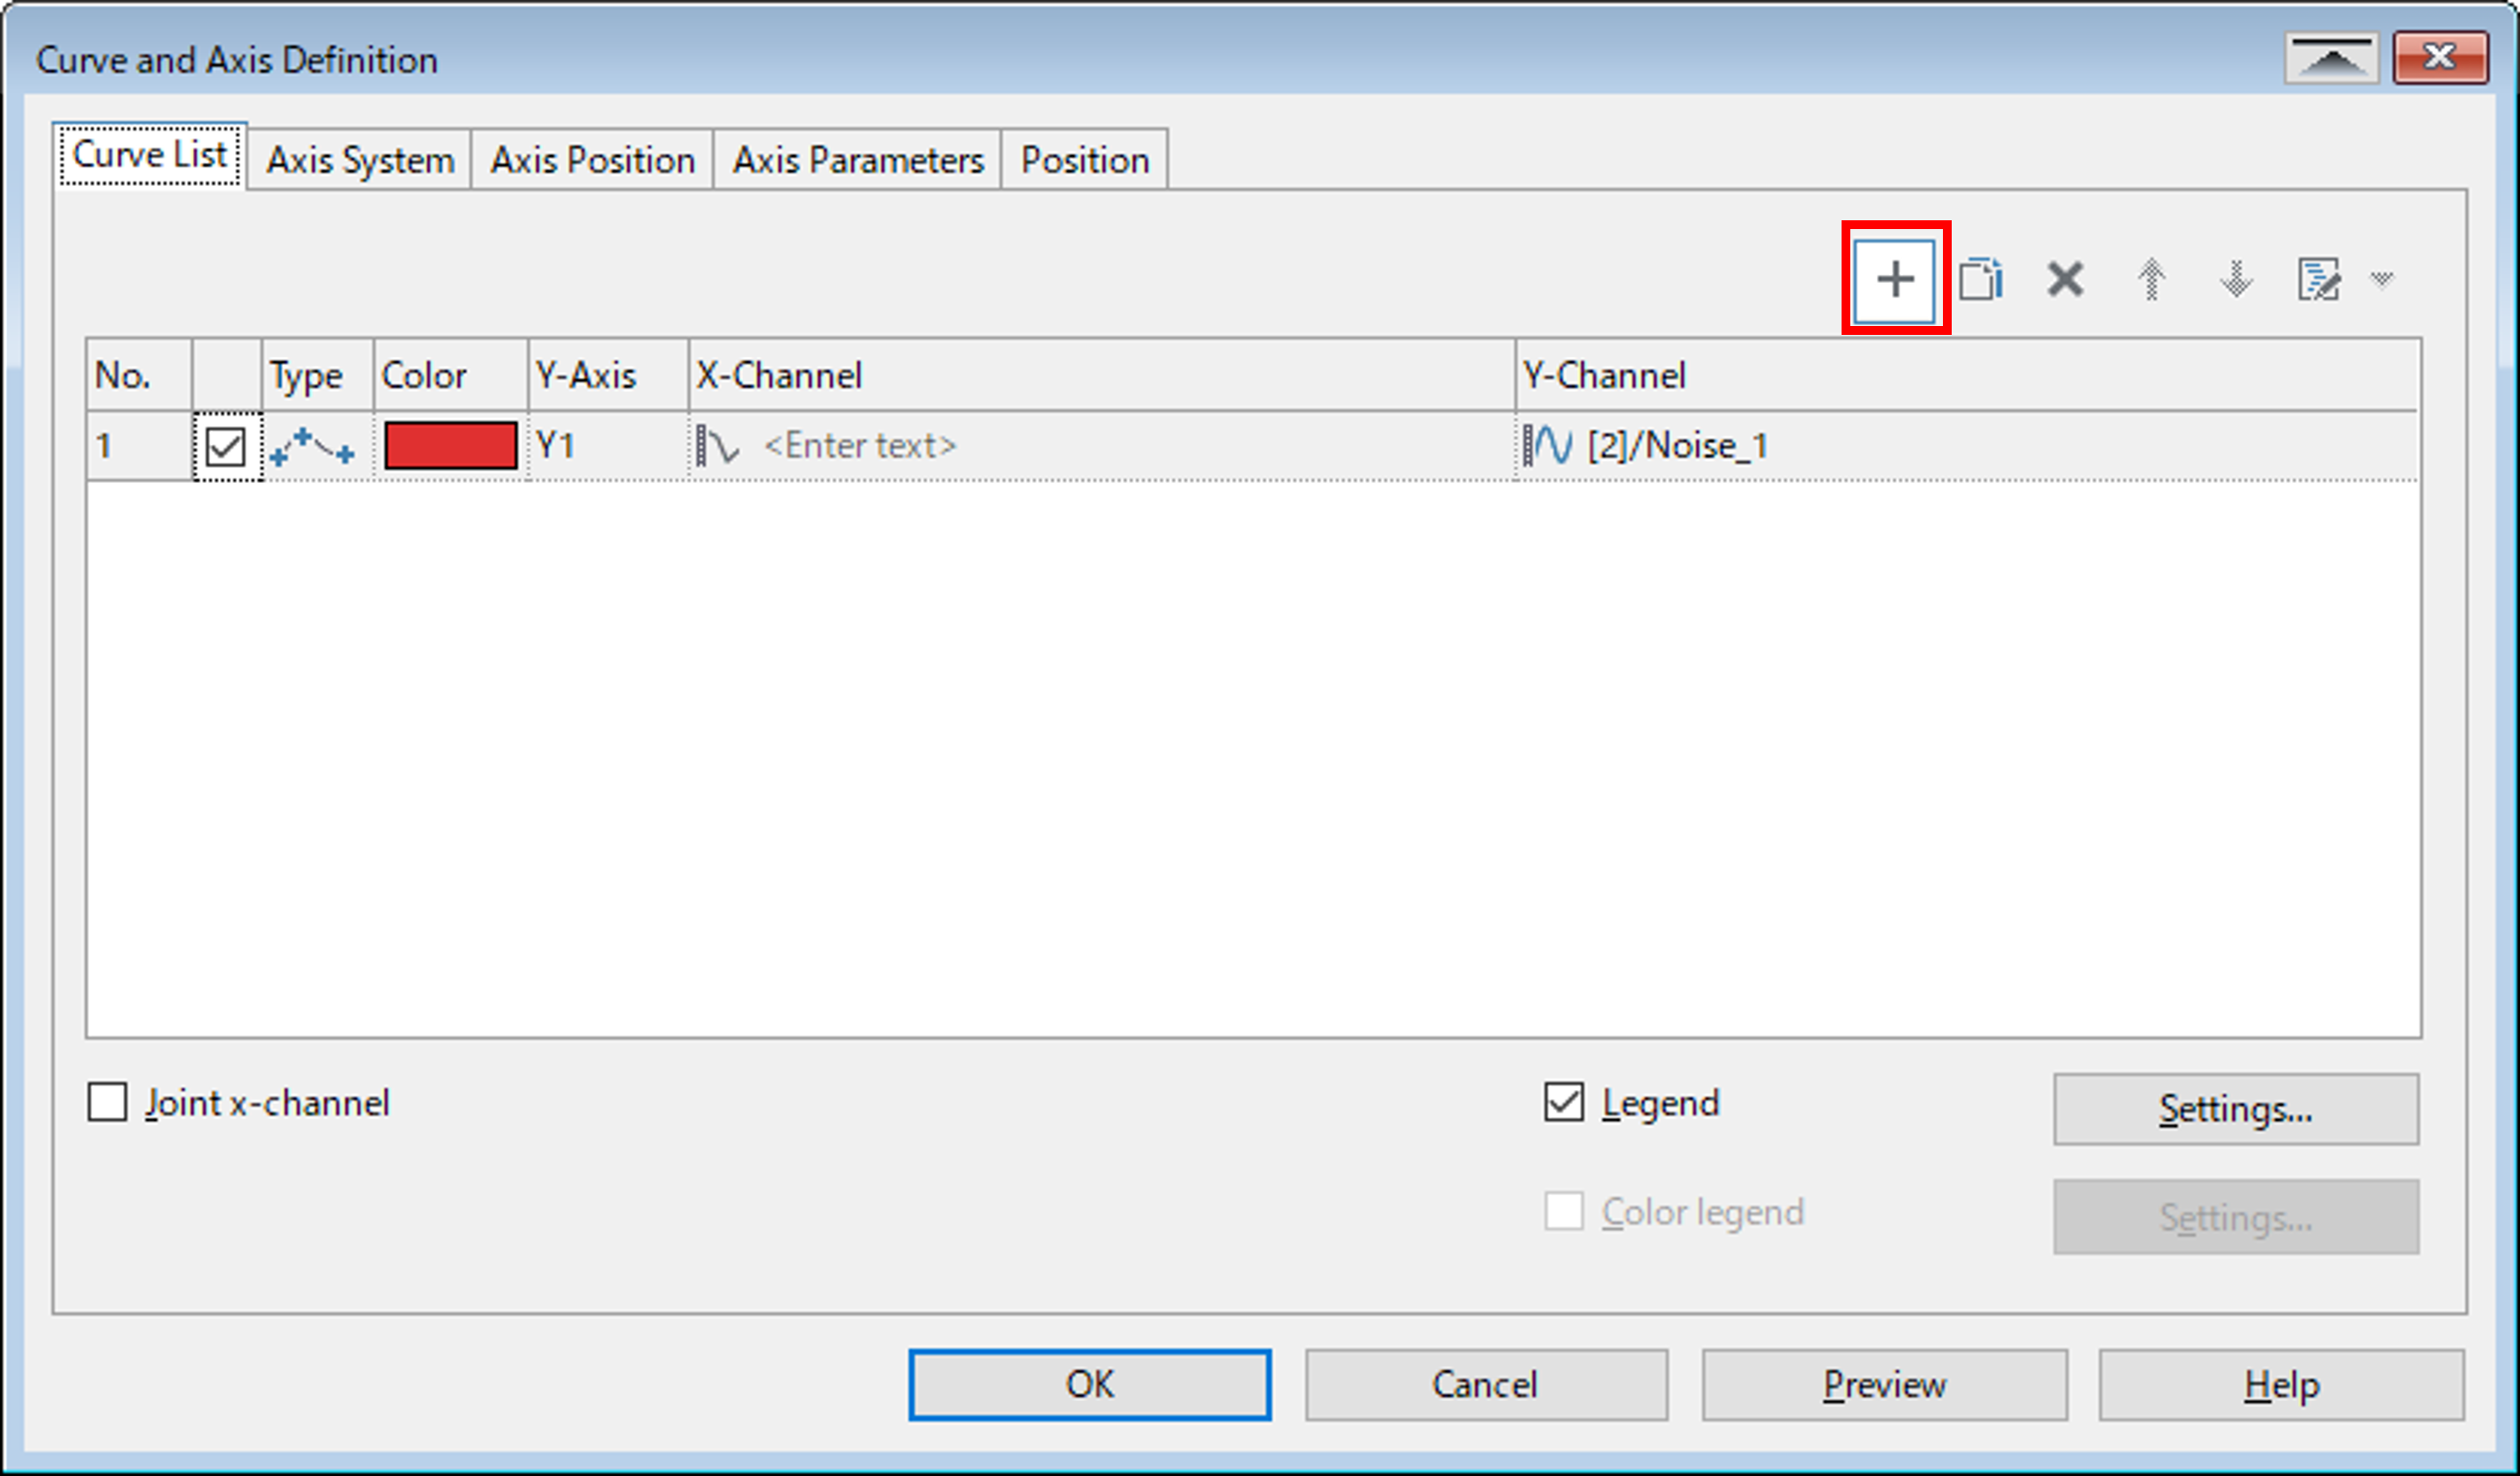
4. To add a line or curve, double-click the 2D Axis Plot.
5. Select New Entry
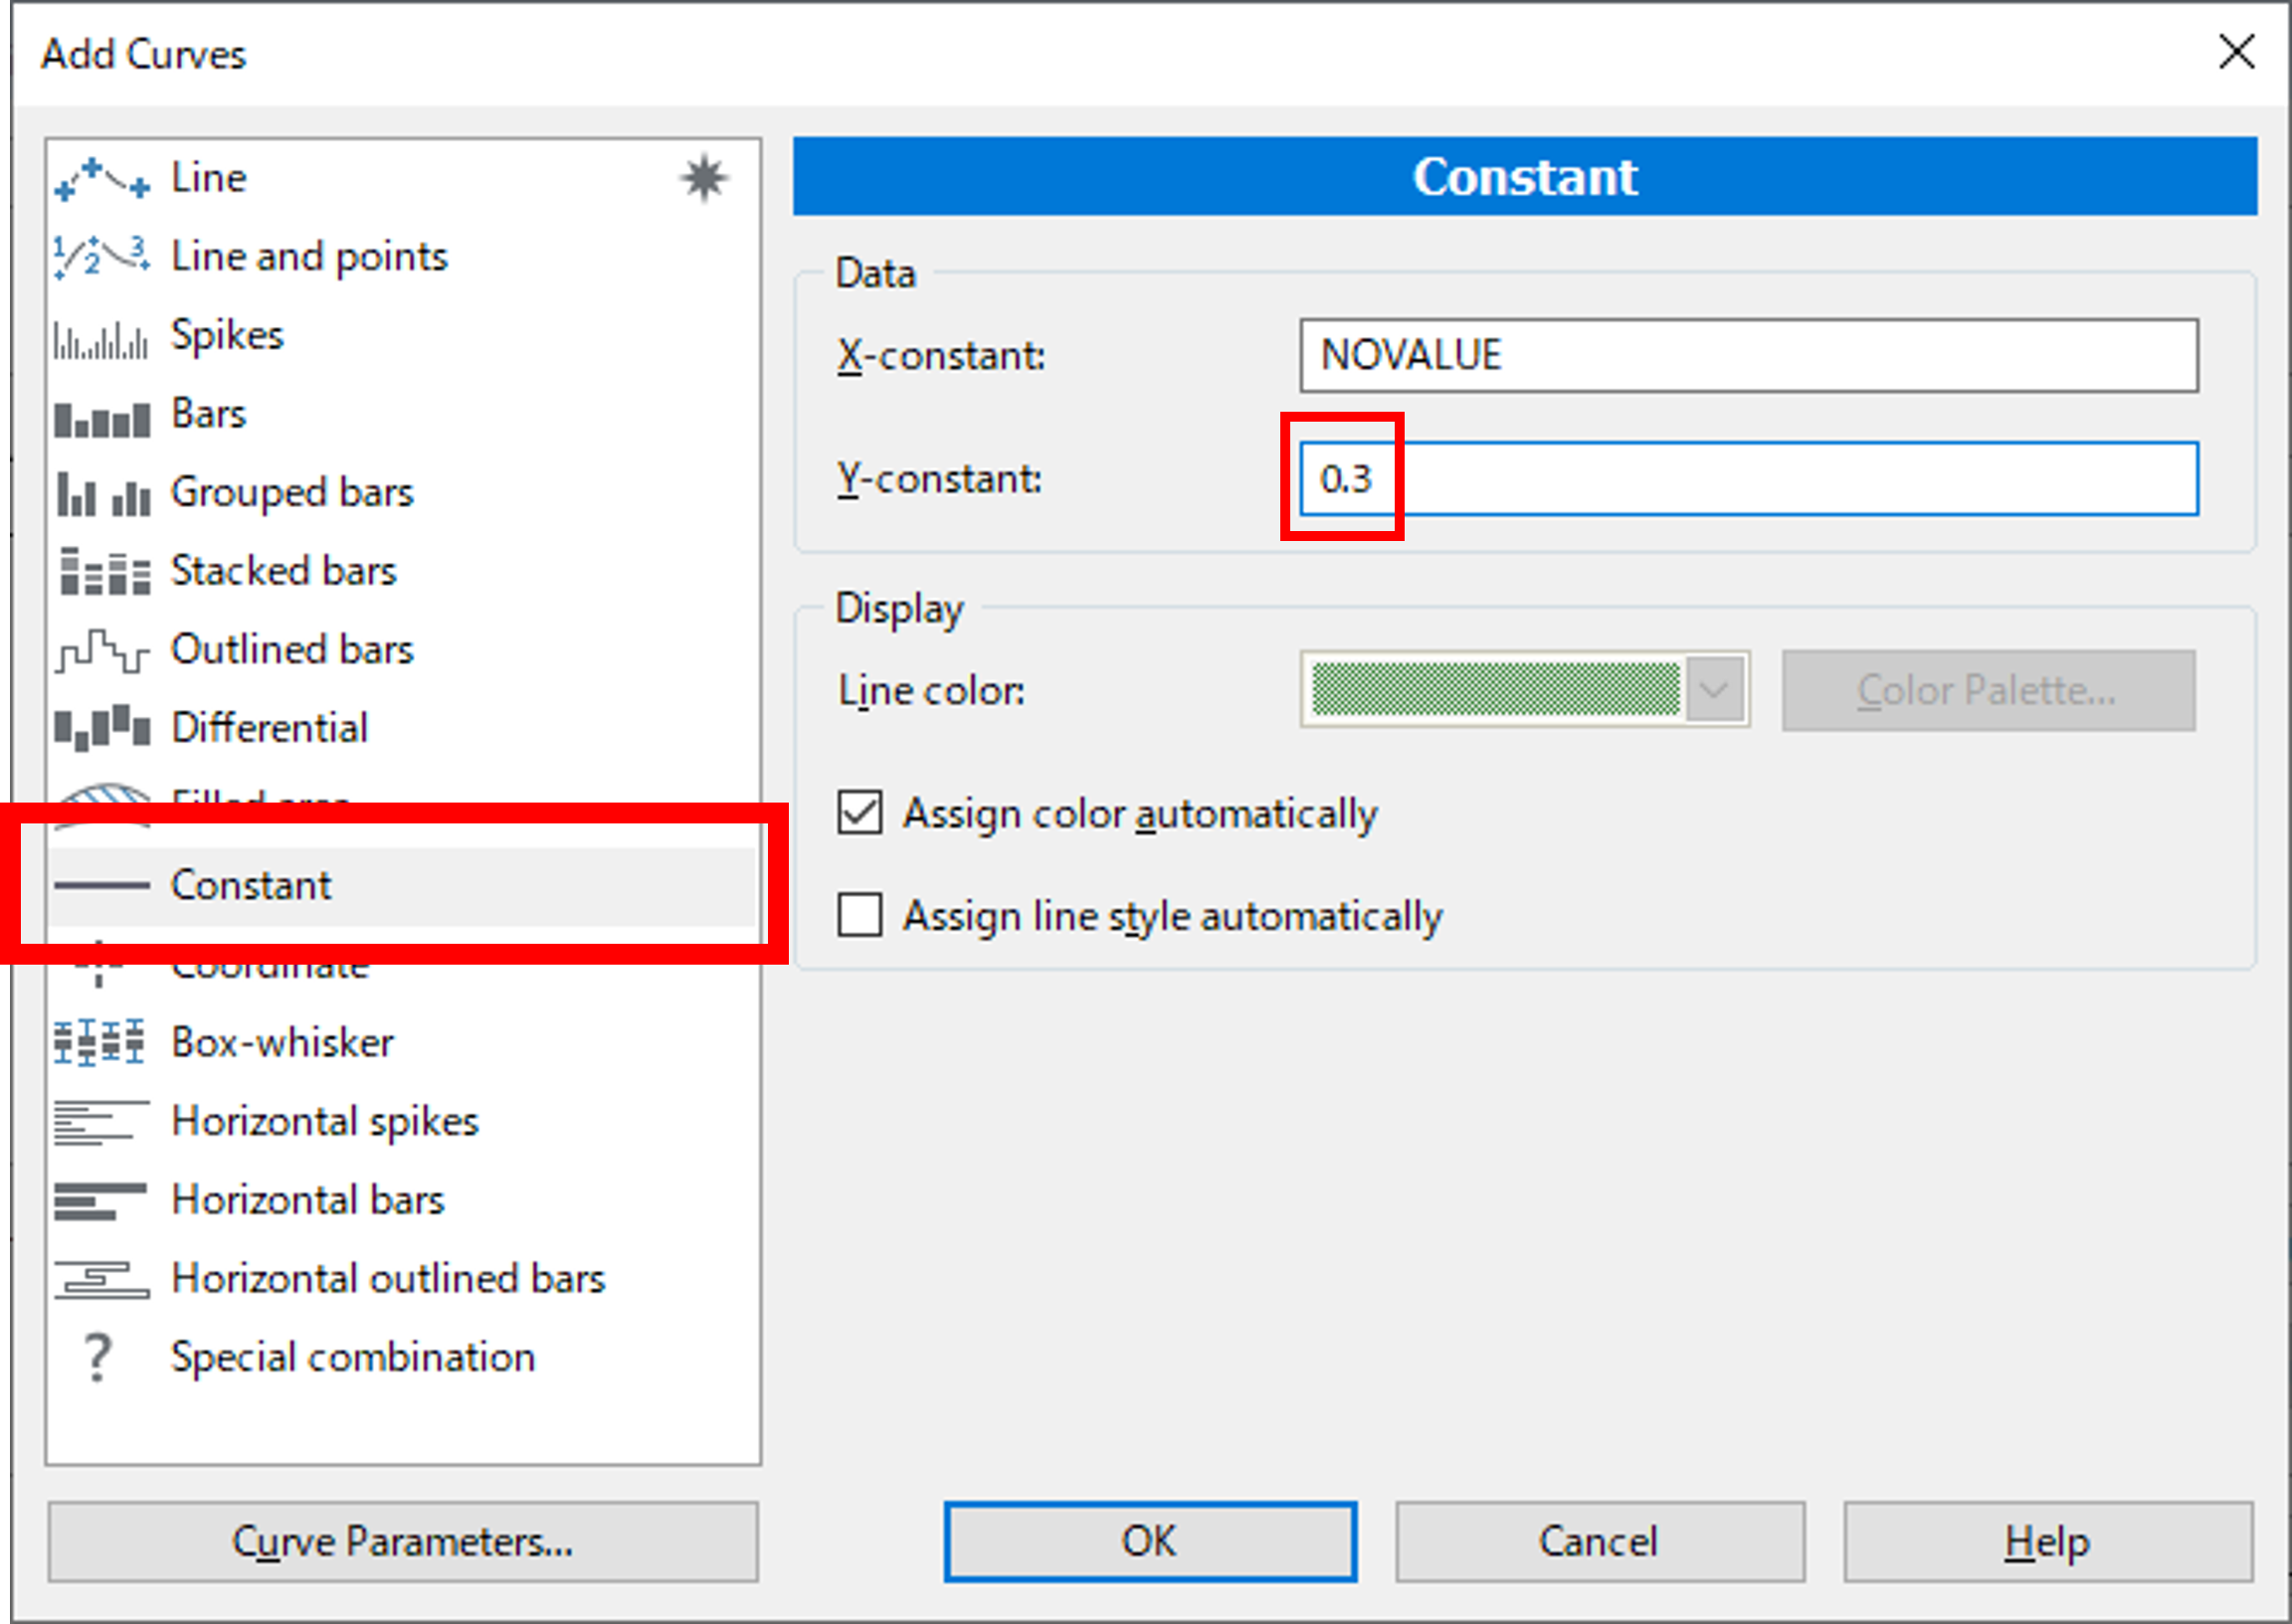
6. To generate a constant line, select Constant from the left hand menu, and type the desired value into the field labeled Y-constant. Click OK until you are back at the main graph.
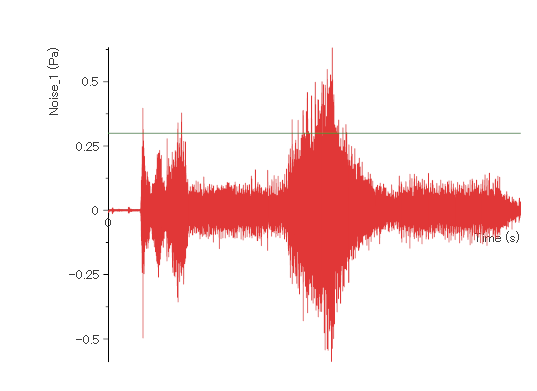
8. You can now view the constant line on your graph.
The below VBSCript will programmatically generate a graph from example data, and then add constant lines to the graph:
'This section of the code creates the Plot
Dim oMy2DAxisSystem, oMyPos, oMy2DCurve, oMy2DConstY,oMy2DConstX
Call Report.NewLayout()
Set oMy2DAxisSystem = Report.ActiveSheet.Objects.Add(eReportObject2DAxisSystem, "My2DAxisSystem")
Set oMyPos = oMy2DAxisSystem.Position.ByCoordinate
oMyPos.X1 = 20
oMyPos.X2 = 80
oMyPos.Y1 = 20
oMyPos.Y2 = 80
Set oMy2DCurve = oMy2DaxisSystem.Curves2D.Add(e2DShapeLine, "MyNew2DCurve")
oMy2DCurve.Shape.XChannel.Reference = "EXAMPLE/Time"
oMy2DCurve.Shape.YChannel.Reference = "EXAMPLE/Speed"
Call Report.Refresh()
'This section of the code creates a new constant curve, which is parallel with the X axis
Set oMy2DConstY = oMy2DaxisSystem.Curves2D.Add(e2DShapeConstant, "MyNew2DConstantY")
oMy2DConstY.Shape.XConstant.Reference = NOVALUE
oMy2DConstY.Shape.YConstant.Reference = 32
Call oMy2DConstY.Shape.Settings.Line.Color.SetPredefinedColor(eColorIndexGreen)
Call Report.Refresh()
'This section of the code creates a new constant curve, which is parallel with the Y axis
Set oMy2DConstX = oMy2DaxisSystem.Curves2D.Add(e2DShapeConstant, "MyNew2DConstantX")
oMy2DConstX.Shape.XConstant.Reference = 30
oMy2DConstX.Shape.YConstant.Reference = NOVALUE
Call oMy2DConstX.Shape.Settings.Line.Color.SetPredefinedColor(eColorIndexRed)
Call Report.Refresh()