Solution
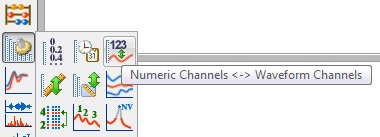
To plot two waveform channels against each other, they first must be converted to numeric channels to extract the time component. This can be done by going to the ANALYSIS pane and selecting the Channel Functions button in the group bar and then the Numeric Channels <-> Waveform Channels button.
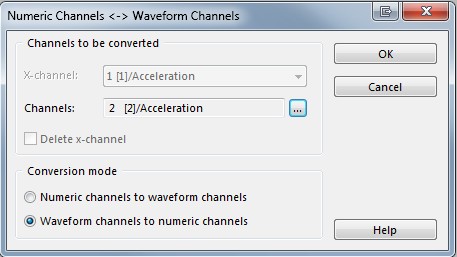
Within the Numeric Channels <-> Waveform Channels dialog box, there is a field for channels to be converted. The waveform channel that needs to be converted can be selected in the Channels field. The conversion mode can then be set to Waveform channels to numeric channels.
Once the channel has been converted, an additional channel will appear in data portal to hold the time information, leaving the original data in a channel without its time component. To plot the two channels against each other, hold down Ctrl and select the channel you wish to be the X data followed by the channel that you wish to be the Y-data, and drag this onto the desired plot.