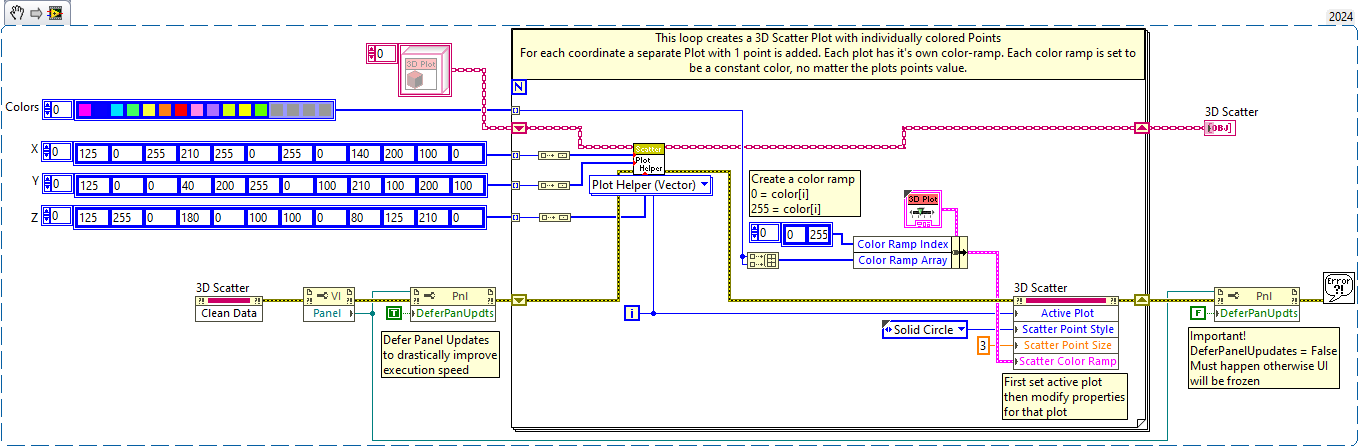
I'm using 3D scatter graph and want to set individual colors for the points in my plot.
The points in a single plor are always colored based on the plots color ramp. To color individual points there is two possibilities:
Note: In order to use this snippet, download this image, and then drag and drop it on your LabVIEW block diagram.
Collaborate with other users in our discussion forums
A valid service agreement or active software subscription may be required, and support options vary by country.
Helpful
Not Helpful