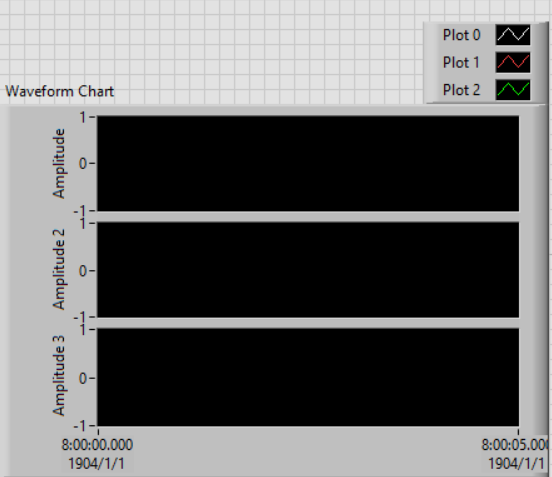
In LabVIEW, you can configure the waveform chart differently to show multiple plots on multiple axes within one waveform chart as below. This article will demonstrate the steps to do so.
If you would like to make sure the waveform chart will automatically update the waveform chart stacked plots, you could use bundle connected to the waveform chart as mentioned in this article: Programmatically Set the Number of Stacked Plots in a Waveform Chart in LabVIEW.
Collaborate with other users in our discussion forums
A valid service agreement or active software subscription may be required, and support options vary by country.
Helpful
Not Helpful