解决方案
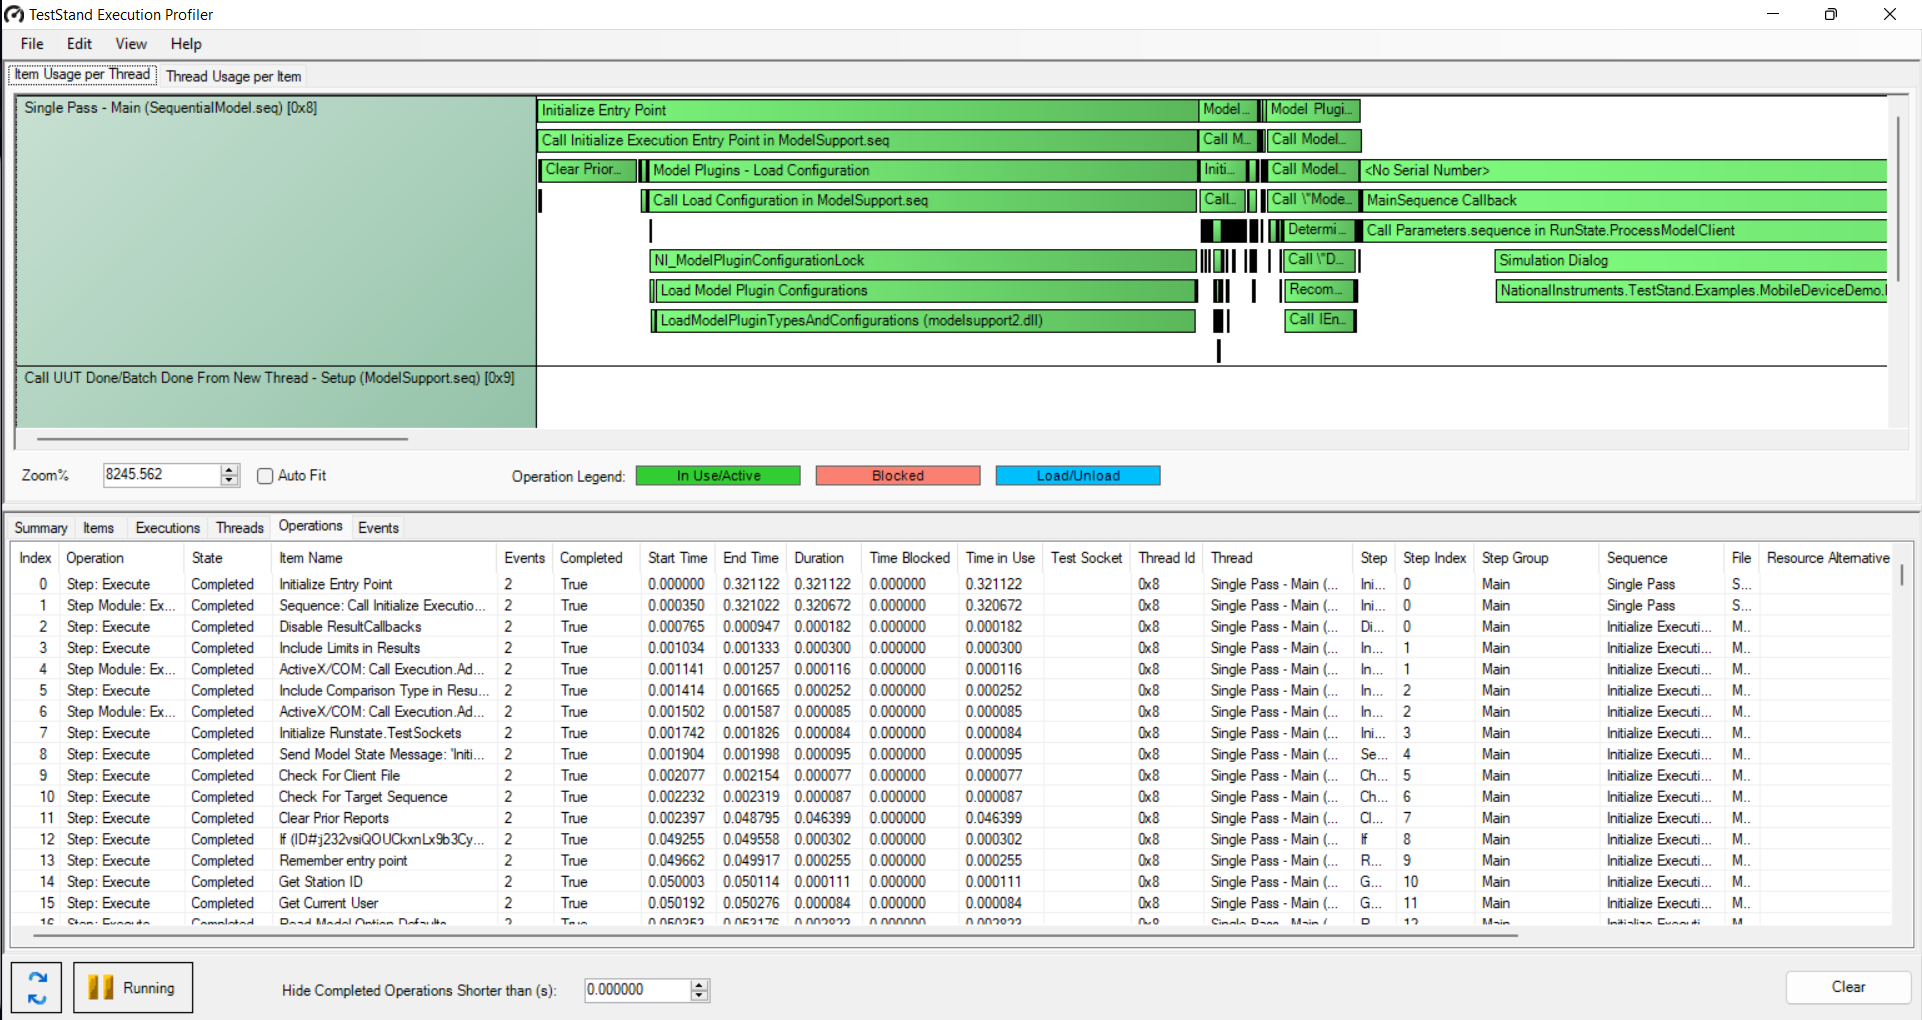
TestStand Execution Profiler 中的执行步骤之间存在差距的原因在于此工具数据收集的设置方式。默认情况下,
Process Model 执行不包含在显示的数据中。
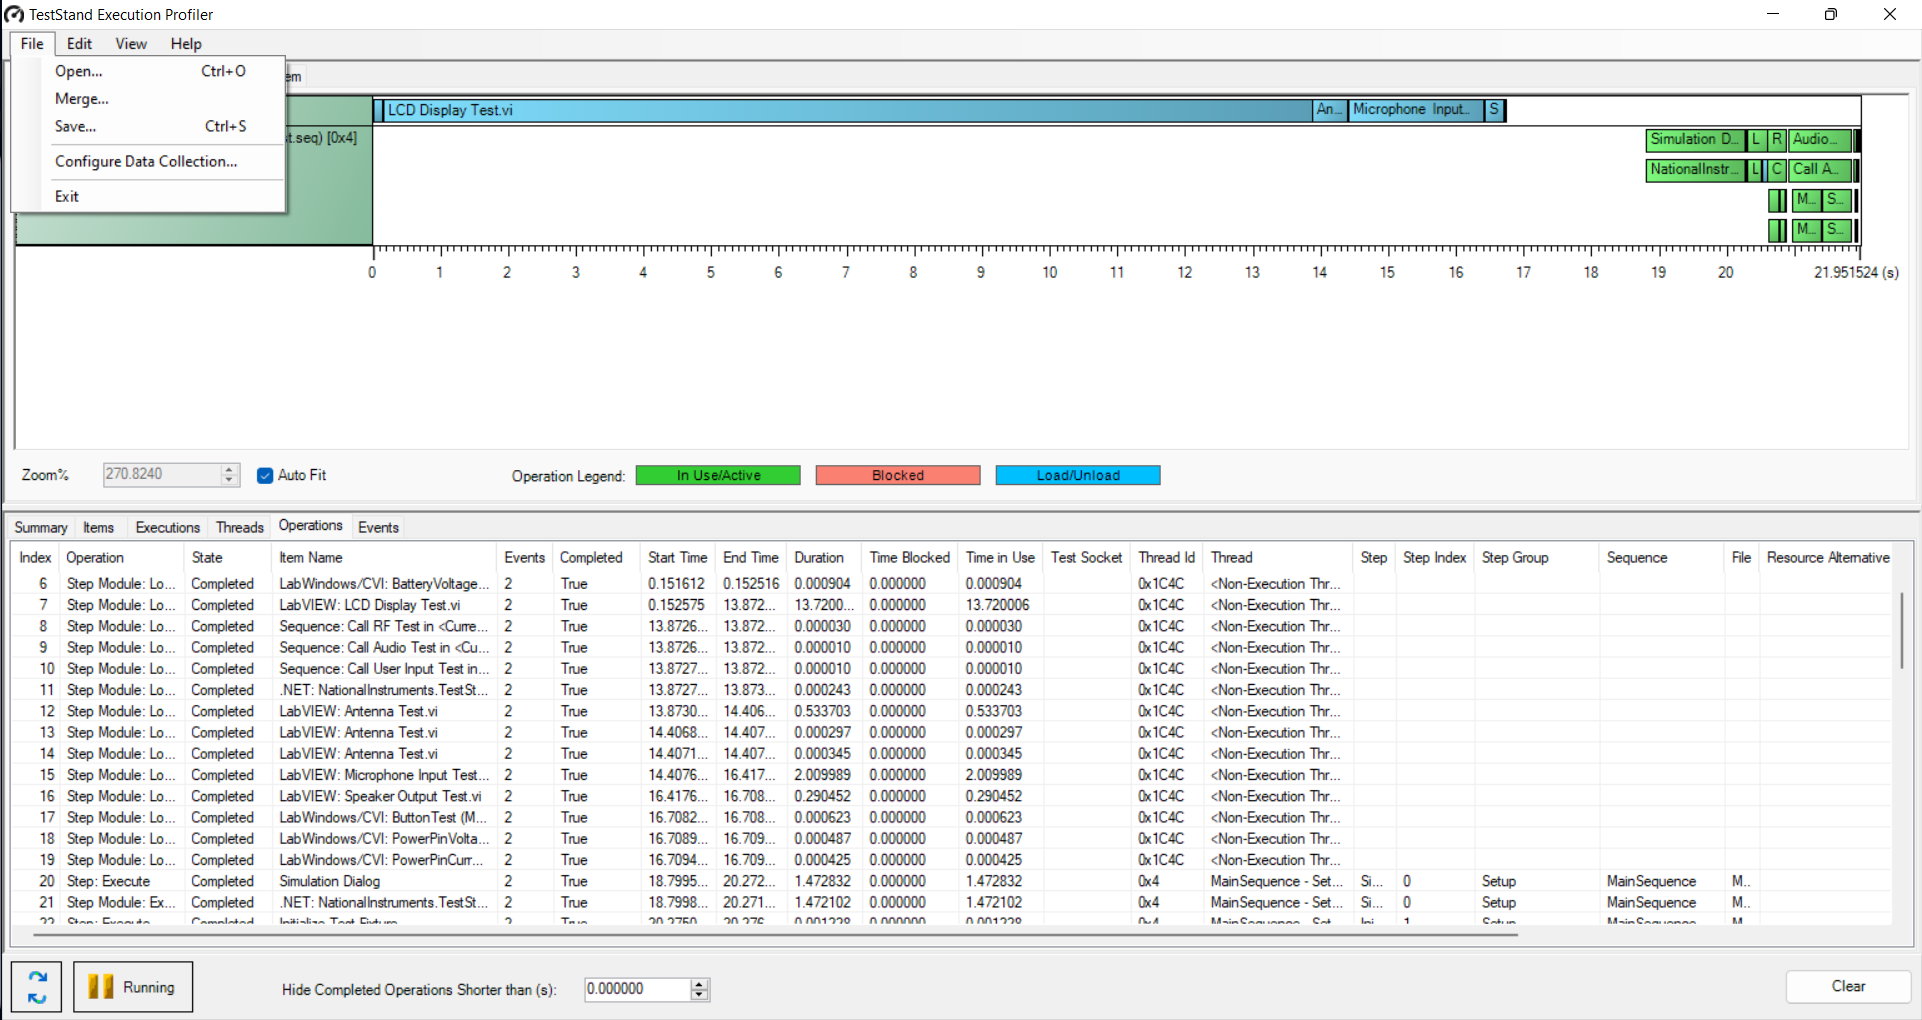
您可以通过导航至
File>>
Configure Data Collection 显示
Configure Data Collection 窗口,从而勾选
Process Model 执行记录。
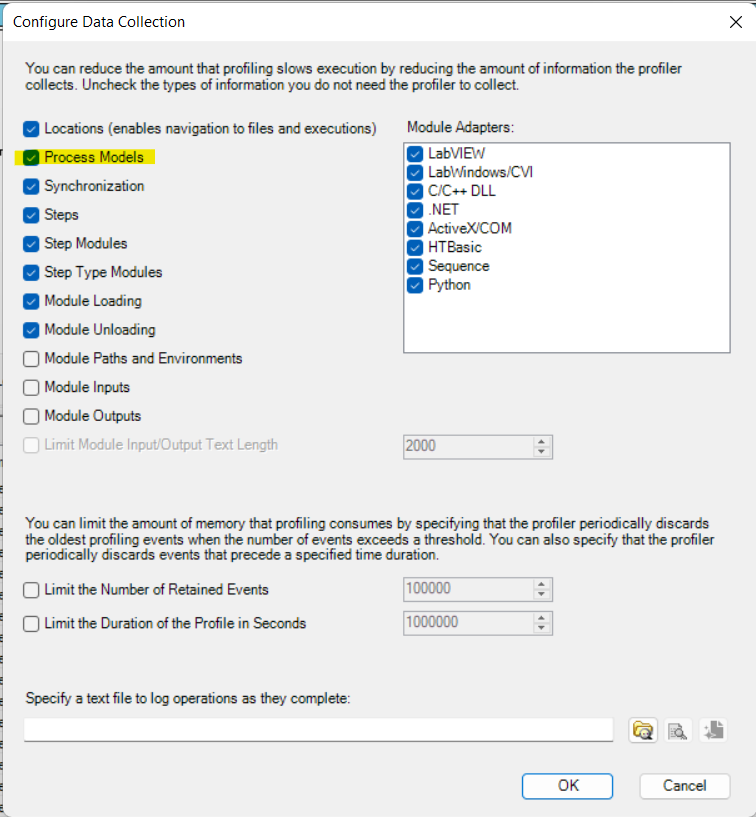
确保
Process Model 复选框被勾选。
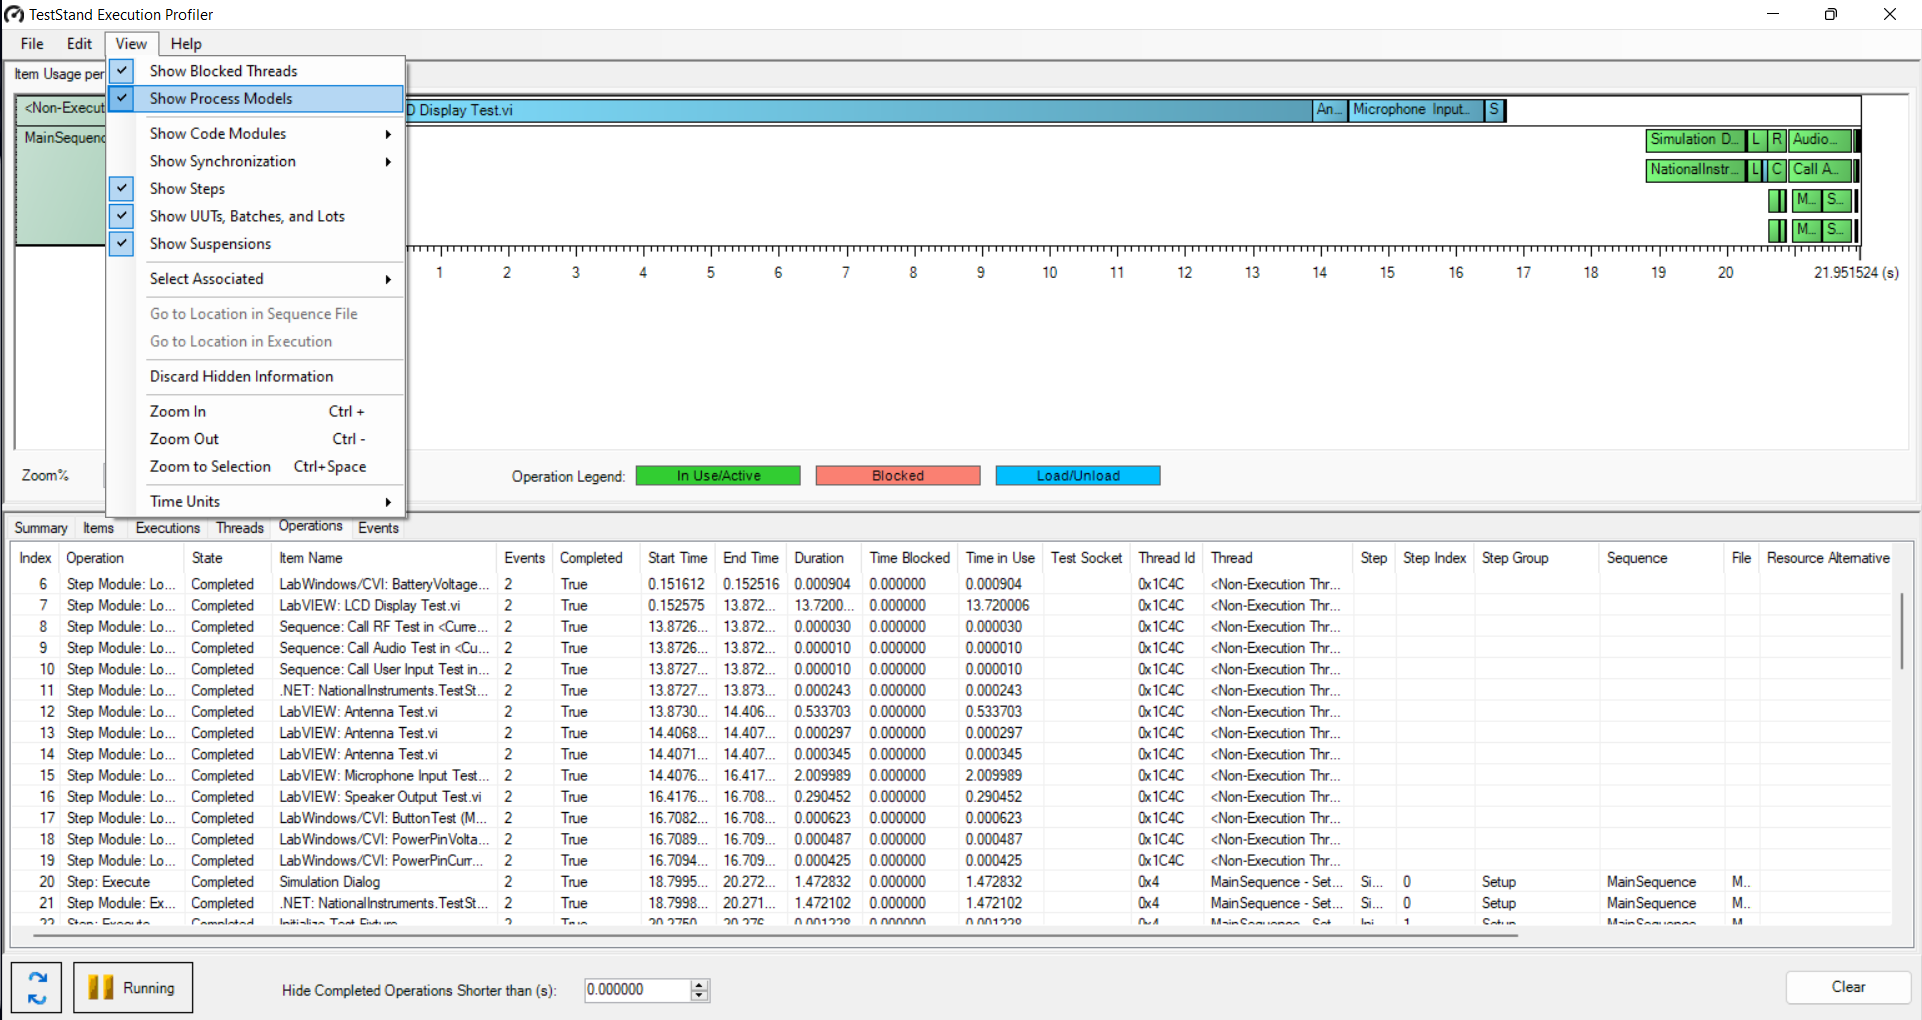
之后,您需要导航到
View 并确保已勾选
Show Process Model ,以便显示
Process Model 执行线程。
按照上述方法更改设置后,您将在 TestStand Execution Profiler 上看到更多详细信息。