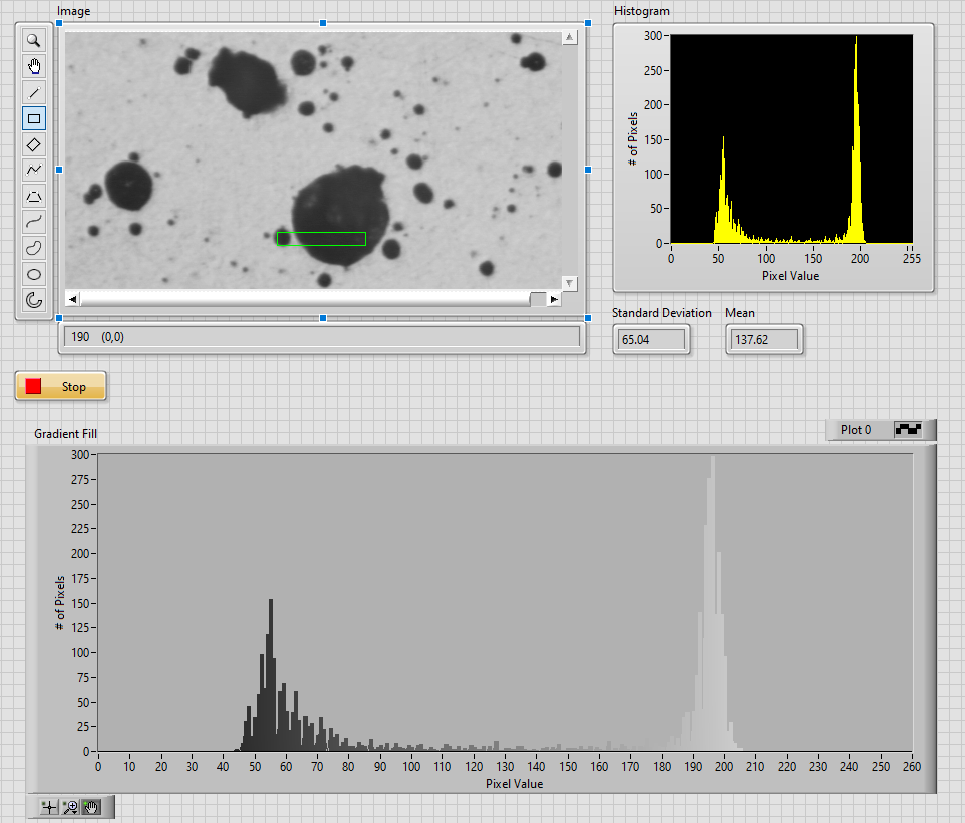
The screenshot shows the result of the processing described.
The green rectangle shows the Region Of Interest (ROI) on the image. The Waveform chart named Histogram shows the histogram of ROI. It is colored yellow by means of LabVIEW's built-in properties.
The waveform chart named Gradient Fill shows the result of the processing of Histogram Chart. It shows the same data but with a gradient fill.