Solution
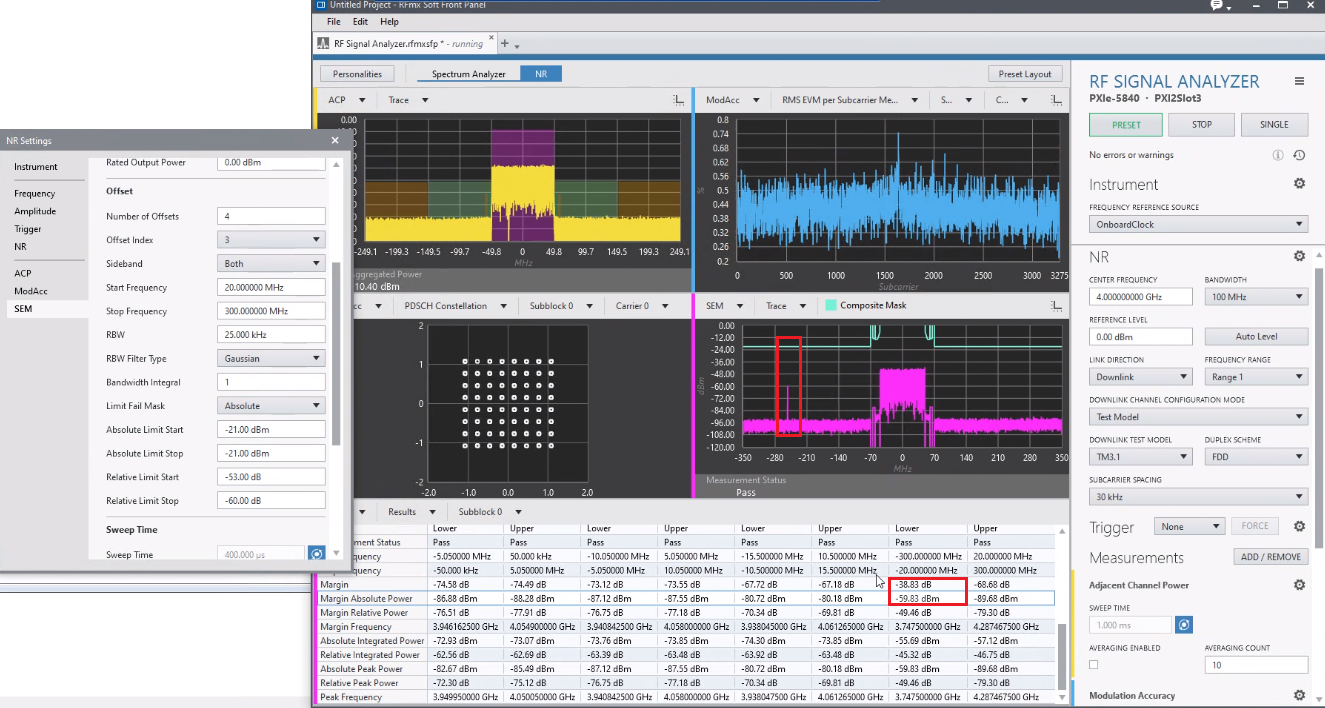
Spectrum Emission Mask (SEM) Measurement checks the presence or absence of signals that exceed the bandwidth and power limits specified by a specific standard induced by RF signal sources. When you check the SEM panel in the figure below, the mask is displayed in blue and the integrated intensity of the signals is displayed in pink. The blue mask is 3GPP compliant or custom mask. In this measurement, it is confirmed that the output signal has strength only in the bandwidth specified by the standard, and the leakage should be within the allowable range in other areas. Therefore, it is desirable that the signal strength is always below the blue mask.

The mask function can be specified as a function for each region, and it is possible to determine how far from the center frequency and what function to use. For example, in the above example, the outermost mask is horizontal and has an intensity of about -24 dBm. Focusing on the results in the negative frequency domain (Lower), there is a strong peak of about -59.8 dBm. In the outermost horizontal mask area, this signal is closest to the mask and "Margin" is small, so the frequency of this part is displayed as "Margin Frequency".
In the case of this signal example, the center frequency is 4 GHz, and since this peak exists in the region about 260 MHz lower than that, the Margin Frequency is about 3.74 GHz.