Configuration Error
When adding the custom device, the Initialization VIs and Page VIs execute and are generally the root cause. Ensure that the VIs referenced in the Custom Device XML file are valid on the computer and are executable. You can use common debugging techniques on above VIs:
If you're porting built custom device LLB files over to a deployment machine, make sure the software stack on both machines is identical. If driver versions are different, for example, the custom device could fail to load correctly into a System Definition because underlying VIs are different.
Deployment and Run-Time Error
Narrowing Down the Error Source
Verify that the error is caused by your custom device by determining that the error does not persist after removing your custom device from your system definition. If you are using multiple custom devices in the project, disable or remove and add custom device one by one to isolate the problematic custom device.
If you are deploying to an RT target, attempt local deployment on your Windows PC. If this deployment is successful, start looking for VIs that are incompatible with RT systems within the custom device as they may be blocking successful deployment.
Next, verify that this error occurs while deploying your system definition file to the target. If you are seeing this error, you should investigate the Initialization phase of your RT Driver VI. This would include the
Initialization and
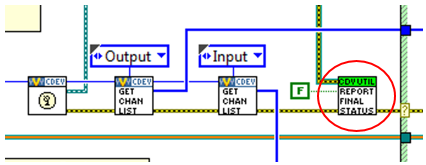
Start cases of an inline hardware or inline model custom device and anything prior to the Report Final Status VI of an asynchronous custom device:

In addition, any
Action VIs that you have configured to run on download or on compile could also cause a deployment error.
Debugging with LabVIEW Development Environment
Custom devices are LabVIEW VIs called dynamically from VeriStand Engine. Develop and test your coding as much as possible using LabVIEW development environment, which allows you to make use of all
Debugging Techniques in LabVIEW.
Debugging within VeriStand Engine
Sprinkle the NI VeriStand – Print Debug Line VI (or NI VeriStand – Print Debug String VI for VeriStand 2018 or earlier) throughout the custom device code to print useful strings to the console to help you debug and trace the execution of the VI. Pair it with Format Into String function to capture as much information as possible, especially for error. To view the printed output, use
Console Viewer. For NI Linux Real-Time targets, see
Access Console and VeriStand Logs for NI-Linux Real-Time Targets.
Debug RT Driver VI engine code on Windows target if possible, you can configure VIs to open their Front Panel automatically to debug using controls and indicators. Please refer to
Control When the Front Panel of a SubVI Opens in LabVIEW.
Benchmarking Performance
- Use System Channels to monitor the performance of VeriStand Engine. Use Telemetry Custom Device to log VeriStand System Channels to a file.
- Refer to Debugging Threads in NI VeriStand to learn how you can use NI Real-Time Execution Trace Toolkit to create execution trace logs for low-level debugging. These logs provide detailed information on thread and VI timing.