Interpolate Colors in an Intensity Graph Using Measurement Studio

Updated Nov 4, 2022

Environment

Software

  • Measurement Studio

This article goes through the steps to interpolate colors on the color scale of an intensity graph using Measurement Studio and WinForms in C#. This will give similar results to using the diffusion setting when plotting a graph in Excel.

This image shows an intensity graph in Excel using diffusion (color interpolation in Measurement Studio):
IntensityWithDiffusion.png

This image shows an intensity graph in Excel without diffusion (without color interpolation in Measurement Studio):
IntensityWithoutDiffusion.png

You need to modify the ColorScale.InterpolateColor property, a boolean value that indicates how the color is calculated for values that do not match entries in the ColorMap or the range Minimum or Maximum. If true, the color is calculated by taking a weighted mean of the colors associated with the color map entry values immediately above and below the value. If false, the color associated with the nearest lower color map entry value is used. 

The ColorScale.InterpolateColor property can also be modified using a Property Editor. You use the PropertyEditor control to edit property values at run time using their associated editors. The editor displayed by the PropertyEditor control is the same editor that is displayed when you edit the property at design time. 

You can find an example of an intensity graph and the results of modifying this property using the color map property editor by opening the project located at: C:\Users\Public\Documents\National Instruments\Measurement Studio\Examples\DotNET\v4.5\UI.WinForms\IntensityGraph\Plotting\cs\Plotting.csproj

In the following images, you can see the results of modifying the ColorScale.InterpolateColor property of an intensity graph using the example located at: C:\Users\Public\Documents\National Instruments\Measurement Studio\Examples\DotNET\v4.5\UI.WinForms\IntensityGraph\Plotting\cs\Plotting.csproj.

To get these results you need to run the program and then click on Edit Color Map >> Color Scale Properties >> Interpolate Colors on Color Scale. By default, this checkbox is selected so if you want to see the results without interpolation deselect this option.

Intensity graph with color interpolation:
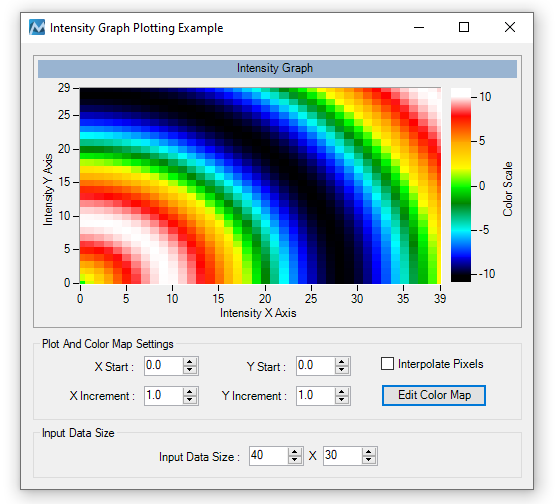
Graph with color interpolation.png

Intensity graph without color interpolation:
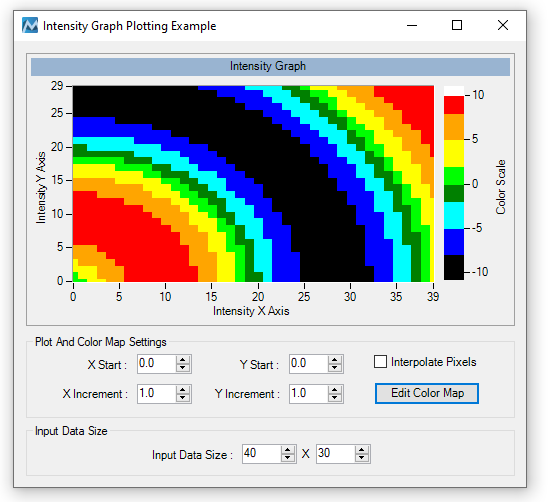
Graph without color interpolation.png