Solution
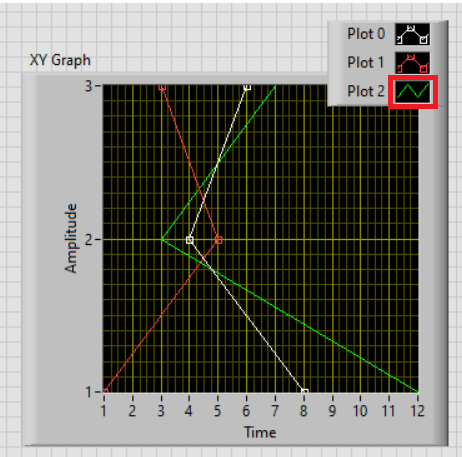
There might be a bug where the waveform plot is unable to display as usual. You may try the following steps to allow the missing waveform plot to displayed on the graph indicator :
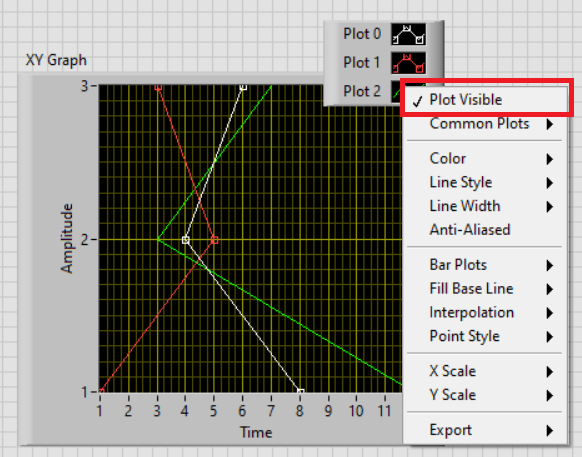
1. Right click on the plot legend as shown in red box in figure below.

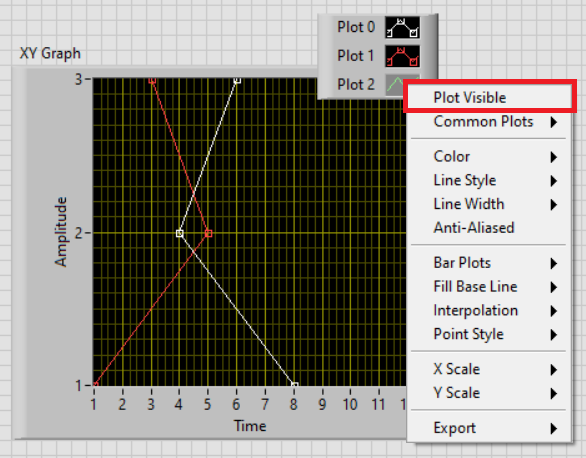
2. Untick the Plot Visible selection in the list.

3. Right click on the plot legend and tick 'Plot Visible' again, and the missing waveform plot will displayed on the graph indicator.
