Introduction to the Excel Reports Library
Microsoft Excel provides a way for developers to programmatically control all of its features via an ActiveX interface. Using this ActiveX interface requires users to be familiar with Excel and its ActiveX Automation class hierarchy. This also requires users to be familiar with ActiveX automation. To simplify development, LabWindows/CVI provides an Excel Reports library that simplifies the process for automating Excel via its ActiveX interface. The library provides higher-level functions to simplify the process of writing data to Excel and using that data to create charts, but if you need more customizations in your Excel report, you will need to use the Excel ActiveX interface directly. We will not be discussing using the Excel ActiveX object library directly in this paper.
The Excel Reports library is available as part of LabWindows/CVI and provides a set of higher-level functions which simplify common Excel tasks. Some of these tasks are:
- reading and writing data
- organizing data into worksheets and customizing worksheets
- running excel macros
- adding charts and customizing them.
The Excel Report generation library can be found under C:\Program Files\National Instruments\<CVI DIR>\toolslib\activex\excel and is called excelreport.fp, where <CVI DIR> is the installed version of LabWindows/CVI. The toolkit consists of a set of high-level functions that are built on top of LabWindows/CVI Activex wrappers generated for Microsoft Excel 2000. Excel maintains backwards compatibility for their ActiveX object library (much like you can open an .xls file created using Excel 2000 in Excel 2003 or higher).
The Excel Reports library ships with its source code so you can view the source if you are interested in learning how it was implemented or if you wanted to extend its functionality.
The functions in the Excel Reports library are broken down into 5 categories.
- Application - Provides functions to launch and quit Excel as well as modify certain properties of the main Excel application window
- Workbook - Provides functions to create new workbooks or open existing ones
- Worksheet - Add new worksheets to a workbook or manipulate the properties of existing worksheets
- Cell Range - Provides functions to manipulate the properties of cell ranges
- Chart - Provides functions to add charts or manipulate existing charts in a workbook
The Excel Reports library does not provide the ability to access every single function available in Microsoft Excel, just the ones that are used most commonly. It is possible to perform advanced Excel manipulations and customizations by starting off with the Excel Reports library functions and then using the Excel ActiveX Object library directly via the wrappers generated by the LabWindows/CVI ActiveX controller wizard.
Using Microsoft Excel from LabWindows/CVI
For the purpose of this paper, we will create a report with three worksheets. The first sheet will contain the raw and processed data. The second sheet will be a chart that plots the raw and processed data. We will then used some advanced Excel features to further customize the report, specifically, annotate the min and the max data points on the graph.
Handling Errors and Cleaning up resources
During the process of report generation, several types of handles to various resources will be generated. It is important to identify how these resources will be dealt with in case of errors or failures. A typically way to do this in LabWindows/CVI is via macros. One macro defined in cviauto.h is called __caErrChk:
/* Use this macro to check return values of functions that return */
/* HRESULTs. To use this macro in a function there must be a local */
/* variable named "__result" of type HRESULT and an "Error:" label */
/* which preceeds the error recovery code at the end of the function. */
#define __caErrChk(fCall)\
\
if (FAILED(__result = (fCall))) {\
    goto Error;\
} else
An example of using this macro is:
 HRESULT __result = S_OK; //This must be defined in order for the macro to work
/* Other code*/
.
.
.
__caErrChk (ExcelRpt_ApplicationNew(VTRUE,&applicationHandle));
__caErrChk (ExcelRpt_WorkbookNew(applicationHandle,&workbookHandle));
/* Other code*/
.
.
.
Error: // This label must be defined for the macro to work.
if(FAILED(__result))
{
    /*Notify the user about error*/
}
CA_DiscardObjHandle(applicationHandle);
CA_DiscardObjHandle(workbookHandle);

return;
If ExcelRpt_ApplicationNew or ExcelRpt_WorkbookNew return an error, execution will jump directly to the Error label, where any handles generated will be discarded using CA_DiscardObjHandle().
It is very important to discard these handles or any other handles generated during the report generation process to ensure no leaks occur. Common symptoms of a leak include total memory used by the application increasing in an unbounded manner over time and “ghost” Excel.exe processes left running even after the application has finished running.
For purposes of keeping the code concise, I will not be using the __caErrChk macro, but it is critical in production code to check functions for errors and to cleanup any handles that are generated.
Launching Microsoft Excel
First we need to launch Excel and create a new workbook for this report using the following functions from the Excel Reports library.
 /*Declare object handle variables*/
static CAObjHandle workbookHandle;
static CAObjHandle applicationHandle;
.
.
.
ExcelRpt_ApplicationNew(VTRUE,&applicationHandle);
ExcelRpt_WorkbookNew(applicationHandle,&workbookHandle);
Make sure to discard the handles applicationHandle and workbookHandle using CA_DiscardObjHandle after you are done with the report.
Now that we have a new workbook, we can start writing some data to Excel.
Write Data to a Microsoft Excel File using Excel Reports
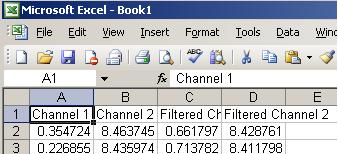
I have raw data that was filtered using the LabWindows/CVI advanced analysis functions that need to go into the first worksheet. It will end up looking like the following in Excel:

We start off by getting a handle to the worksheet:
 /*Declare worksheet handle*/
static CAObjHandle rawDataWorkSheetHandle;
.
.
.
//Get the worksheet handle. You can also get the worksheet handle by the name of the worksheet using ExcelRpt_GetWorksheetFromName()
ExcelRpt_GetWorksheetFromIndex(workbookHandle,1,&rawDataWorkSheetHandle);
//Rename the worksheet to “Analysis Data”
ExcelRpt_SetWorksheetAttribute(rawDataWorkSheetHandle,ER_WS_ATTR_NAME,"Analysis Data");

Now that we have the handle to the worksheet, we can start writing some data to it:
 //define the channel header text.
char* channelHeaders[] = {"Channel 1","Channel 2","Filtered Channel 1","Filtered Channel 2"};
.
.
.
ExcelRpt_WriteData (rawDataWorkSheetHandle,"A1:D1",ExRConst_dataString ,1,5,channelHeaders);
Now that we have our headers, we can send all the raw and filtered data to Excel. I used a 2D array and broke it down into multiple calls, but you can easily specify a 2D range in Excel and write the entire array in one call.
 //data is a 1250x2 array of doubles. DATASIZE = 1250
ExcelRpt_WriteData (rawDataWorkSheetHandle, "A2:A1251",
ExRConst_dataDouble, DATASIZE, 1, data[0]);
ExcelRpt_WriteData (rawDataWorkSheetHandle, "B2:B1251",
ExRConst_dataDouble, DATASIZE, 1, data[1]);

//smoothdata is a 1250x2 double array of filtered data.
//DATASIZE is still the same
ExcelRpt_WriteData (rawDataWorkSheetHandle, "C2:C1251",
ExRConst_dataDouble, DATASIZE, 1, smoothdata[0]);
ExcelRpt_WriteData (rawDataWorkSheetHandle, "D2:D1251",
ExRConst_dataDouble, DATASIZE, 1, smoothdata[1]);
Now Excel has all the data is needs and we can now start charting our data.
Note: You can easily read any data from Excel via ExcelRpt_ReadData. If you already have all your data in a LabWindows/CVI table control, you can use ExcelRpt_WriteDataFromTableControl and ExcelRpt_ReadDataToTableControl to write and read to and from the table control.
Adding a Graph to the Microsoft Excel Report
For this report, we will add a chart as a new sheet:
 CAObjHandle chartsheetHandle;
.
.
.
//Create a new chart with its own worksheet
ExcelRpt_ChartNew(workbookHandle,-1,&chartsheetHandle);

//Create a XY scatter chart using the data we wrote to the worksheet as its data source.
ExcelRpt_ChartWizard (chartsheetHandle, rawDataWorkSheetHandle, "A1:D1251",
ExRConst_GalleryXYScatter, ExRConst_Columns, 0, 0, 0, 0
"Filtered Data Chart", "", "Weather Data", NULL);

//Change the plot lines to not display markers and smooth out
//the plot lines. This is one of the plot styles available in Excel.
ExcelRpt_SetChartAttribute (chartsheetHandle, R_CH_ATTR_CHART_TYPE,
ExRConst_XYScatterSmoothNoMarkers);
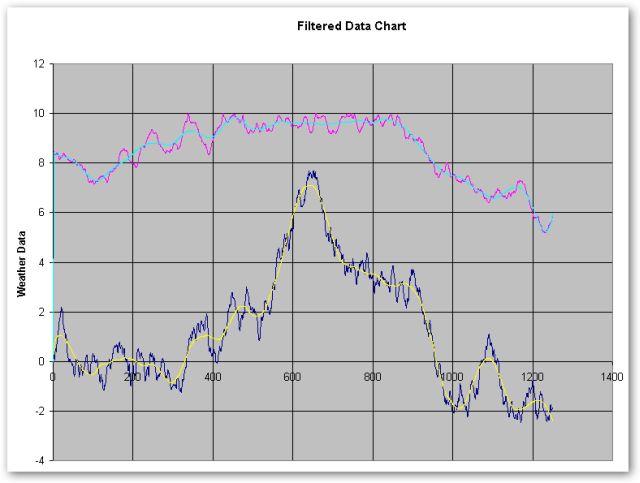
This will generate the following type of chart:

You can further customize the graph by using the attributes provided by ExcelRpt_SetChartAttribute(). See the function documentation for more information.
Tip: You can easily add a chart as an embedded object on a worksheet instead of adding it as a new sheet by using ExcelRpt_ChartAddtoWorksheet(). You can then use the chart handle generated by this function and perform the same type of manipulations described here.
Running Excel Macros
Microsoft Excel allows you to record your mouse-clicks and keystrokes as you manipulate the workbook and then play it back later. These commands are stored as macros in the workbook. Sometimes you might be manipulating an existing report template which already contains some code stored in the form of macros. When you run a macro, Excel plays back your actions as if you had just entered the commands yourself. The LabWindows/CVI Excel Report includes the function ExcelRpt_RunMacro() , which allows you to run a macro by its name.
For more information about recording and running Excel macros, refer to the Excel Language Reference documentation.
Conclusion
We discussed the LabWindows/CVI Excel Reports library and saw some of the basic features it offers developers who need to manipluate Excel to create reports. We merely scratched the surface of all the functionality that the library provides. The library simplifies the process of transferring data to and from Excel and provides a quick way to display large data sets via professional looking charts. And since the source code for the library ships with LabWindows/CVI, it also serves as a stepping stone for developers wanting for extend the capabilities of the library.