“Pulling” Citadel Data into DIAdem via DIAdem Data Stores
Using DIAdem data stores to retrieve Citadel data into DIAdem is as easy and flexible as the Historical Data Viewer. DIAdem data stores allow you to identify the location of your pertinent historical data, identify specific traces, alarms or events, and even isolate a time region of interest for loading.
To load historical, time-based measurement data into DIAdem from Citadel, use the following step-by-step procedure as a guide.
- Start DIAdem.
- From the DIAdem NAVIGATOR panel – used for data search, import and export – select the Settings » Data Stores… menu. This brings up the Data Store Settings dialog box, as shown in Figure 1.
Note: When interfacing with files on disk, DIAdem uses the built-in NI My DataFinder or the optimized, server-based NI DataFinder Server Edition to search for, locate and load file-based measurement data. DIAdem also features interfaces to databases such as SQL, ASAM ODS or Citadel, which are accessible instead using Data Stores.
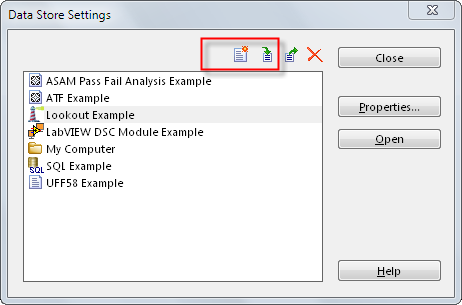
Figure 1. The Data Store Settings dialog box allows DIAdem users to interfaces with databases such as SQL or Citadel instead of just data files.
- The default configuration of the Data Store Settings dialog box includes a series of examples demonstrating DIAdem’s interface to databases such as SQL, ASAM ODS and Lookout. To create a new data store, select Create Data Store, as identified in Figure 1.
- The New Data Store configuration dialog box allows you to provide a name for your datastore and select the type of interface used to connect to the data store. Provide an example name in the Name input. Use Table 1 to identify which server-based DataPlugin to choose, depending on your software version.

Table 1. Choose the Citadel DataPlugin version based on the version of your NI LabVIEW DSC Module or Lookout software.
- Your configuration should resemble Figure 2 (your entries and selections may vary). Select OK.
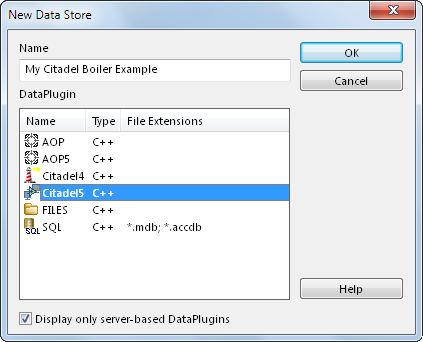
Figure 2. Provide a name and DataPlugin for your data store using the New Data Store dialog box.
- The Open Data Store dialog box, which automatically appears, allows you to configure the parameters used when opening the data store. Manually enter (or browse to) the location of your database within the Citadel data universe.
- You can optionally choose to retrieve only data logged within a specified time interval or perform calculations on the data from the database before it is retrieved. By selecting the Advanced button, you can also choose whether or not to retrieve alarm and event channels.
- Select OK to close the Open Data Store dialog box shown in Figure 3.
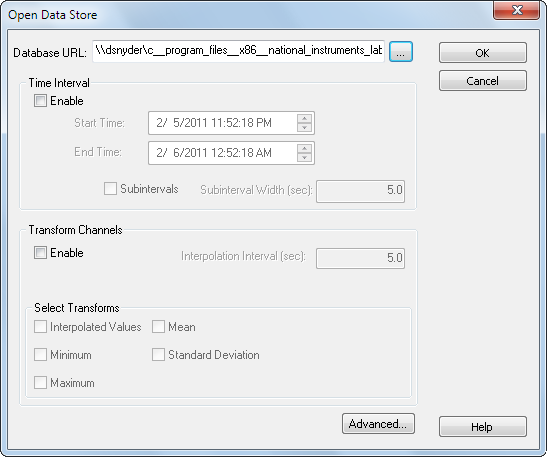
Figure 3. The Open Data Store dialog box - shown here using the Citadel 5 DataPlugin - allows you to configure the parameters used when opening the data store.
- To open the data store immediately and connect to the Citadel database, choose the data store and select Open from the Data Store Settings dialog box.
- The data store appears with the specified settings within the NAVIGATOR panel. At this point, you can browse the data within the database to find and load specific traces, alarms or events, as shown in Figure 4.
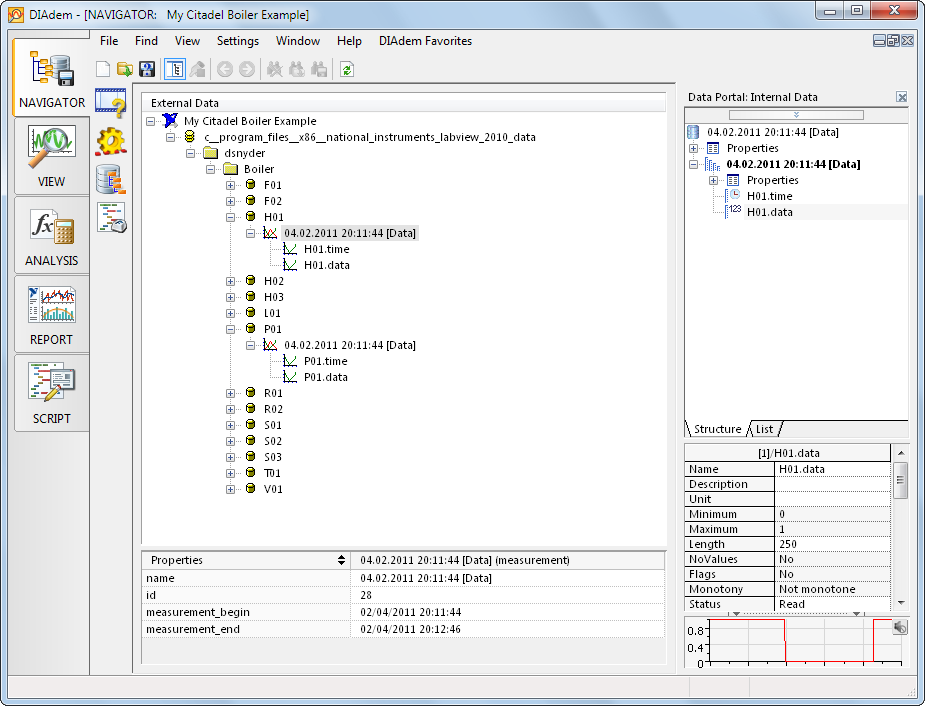
Figure 4. You can browse the data store to find select traces, alarms or events.
- Optionally, you can filter the data using the Set Filter Parameters dialog box, accessible by right-clicking and selecting Filter Settings. This enables you to specify filter parameters for each object in the database in order to limit the data shown in the NAVIGATOR. The Set Filter Parameters dialog box is shown in Figure 5.
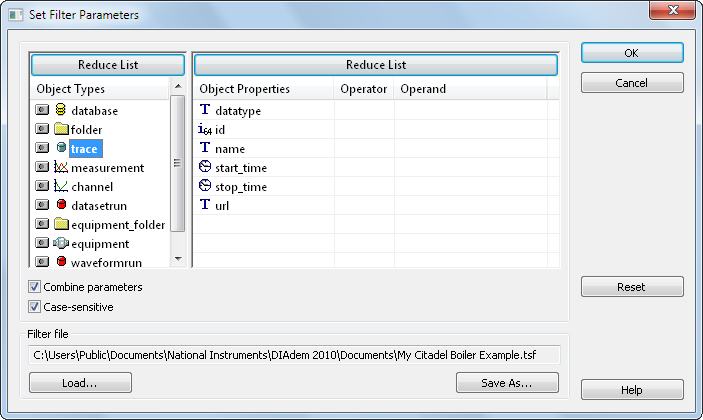
Figure 5. The Set Filter Parameters dialog box allows you to reduce the data visible in the data store.
- Load measurement by either drag-and-dropping the measurement into the Data Portal, or by right-clicking and selecting Load Data from the context menu.
Processing Citadel Data in DIAdem
The typical postprocessing workflow involves loading data, visualizing (graphing) data, performing analysis, and creating a report. NI DIAdem features a built-in workflow that directly conforms to these common postprocessing tasks.
Visualizing Data using DIAdem VIEW
DIAdem features a wide variety of visualization options that go beyond graphs and spreadsheets to include synchronization of data with maps, 3D models, video and more. To visualize Citadel data on a graph and spreadsheet in DIAdem, use the following steps as a guide:
- Switch to the DIAdem VIEW panel to access visualization capabilities.
- Select a built-in VIEW layout such as 2D Axis System / Channel Table Horizontal, as shown in Figure 6.
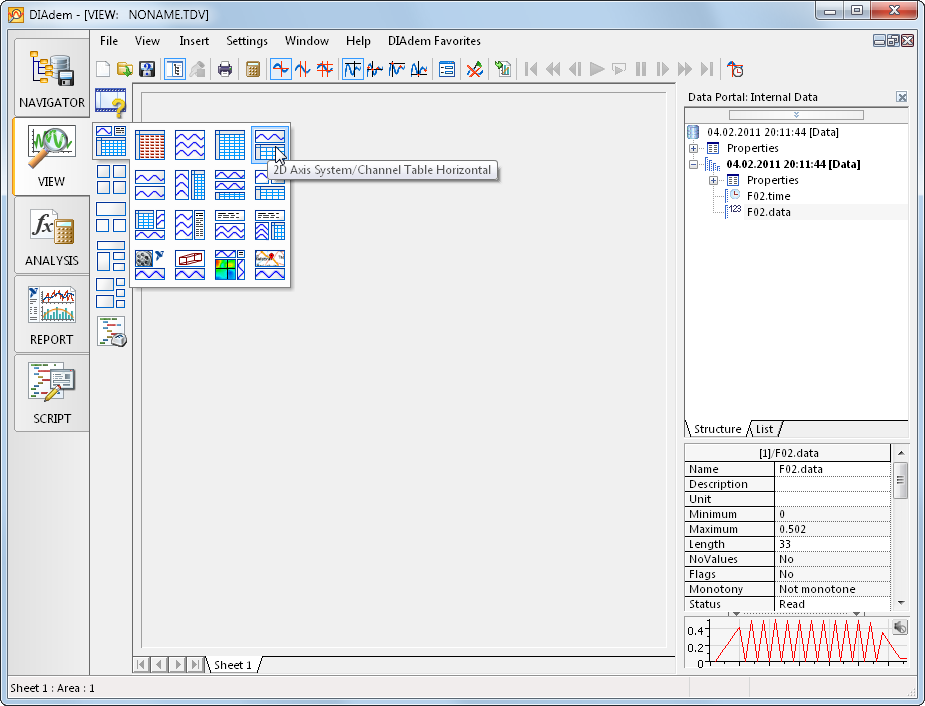
Figure 6. You can create custom VIEW layouts, or select from a list of predefined layout options.
- Drag-and-drop the channel group containing your trace channels onto the 2D axis system to graph your data versus time.
- Drag-and-drop the channel group containing your trace channels onto the channel table to view a spreadsheet containing your data channels.

Figure 7. Explore the variety of synchronized visualization options in DIAdem that go beyond simple spreadsheets and graphs.
Analyzing Data using an FFT
DIAdem’s library of built-in analysis functions includes hundreds of different calculations that do not require programming; as a result, performing analysis on Citadel data is as easy as choosing a specific calculation and configuring the correct parameters. For example, to run a fast Fourier transform on your Citadel data use the following step-by-step procedure as a guide:
- Switch to the DIAdem ANALYSIS panel to access DIAdem’s library of interactive analysis calculations.
- Select FFT (One Time Signal) from the Signal Processing library as shown in Figure 8.
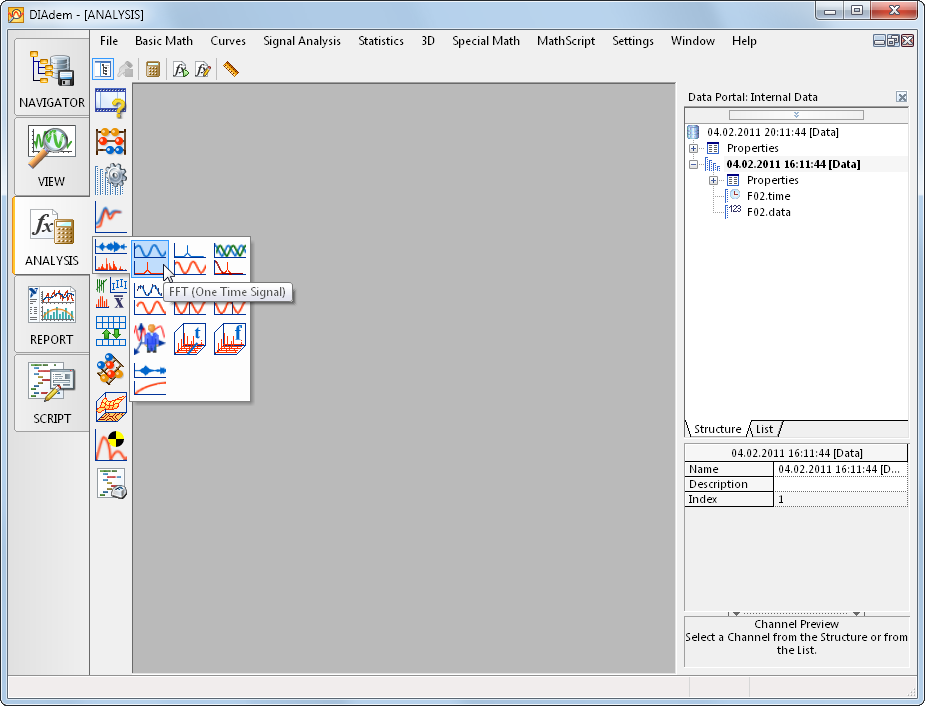
Figure 8. DIAdem's analysis functions include everything from simple addition and subtraction to complex signal processing and 3D data manipulation.
- In the Time Channel drop-down menu, select the channel that represents your time channel, or simply drag-and-drop directly from the Data Portal.
- In the Signal Channels drop-down menu, select the channel that represents your data, or simply drag-and-drop directly from the Data Portal.
- Use the rest of the configuration options within the FFT with One Time Signal dialog box to specify the parameters to be used in the FFT calculation, including window type, time intervals, and amplitude attenuation correction.
- The DIAdem analysis functions give a preview of the resultant data before actually running the calculations. When you’ve specified the parameters you need, select OK to run the calculation and generate a resultant channel for use in the Data Portal. When configured, the dialog box will look similar to Figure 9.
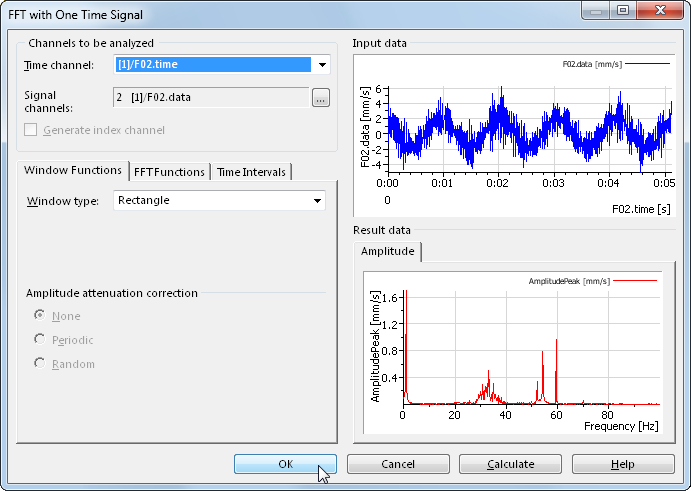
Figure 9. DIAdem's analysis calculations are configuration-based and require no programming.
Creating a PDF Report
DIAdem’s report creation tool is a what-you-see-is-what-you-get (WYSIWYG) interface, meaning that you can “draw” components on a canvas to actually create your report. To create a report using Citadel data:
- Switch to the DIAdem REPORT panel to access reporting functionality.
- Use the built-in template as a starting guide, or begin with a blank canvas by selecting New Layout from the toolbar.
- Use the report components built into the group bar on the left-hand side of the environment to access graphs, tables, images, polar plots, decorations, and more in order to create your report template.
- To populate graphs or tables with data, simply drag-and-drop channels from the Data Portal.
- Your completed report will look similar to Figure 10.
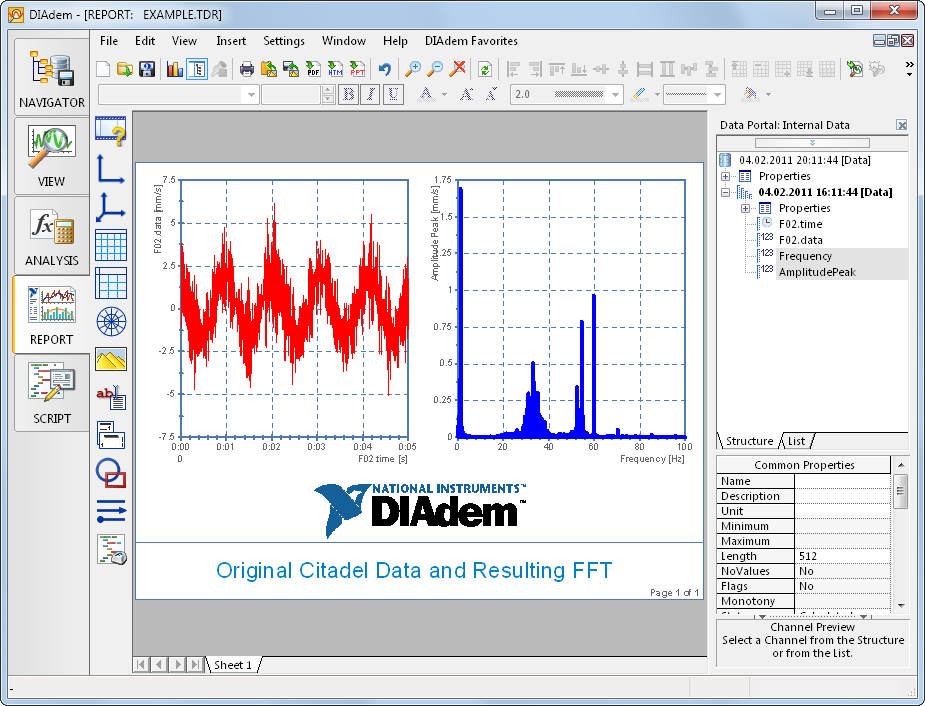
Figure 10. DIAdem's what-you-see-is-what-you-get (WYSIWYG) report tool makes it easy to create high-quality, professional reports.
- Once you have completed designing your report, use the File menu to export data to a more portable format. For example, select File » PDF Export… to export your report to a multi-page PDF file that you can email to colleagues, or select File » PowerPoint Export… to save a multi-slide PowerPoint presentation so that you can present your findings to your manager.