Required Software:
- NI LabVIEW DSC Module 7.xor above
- Microsoft Excel 2007
- Microsoft Query
Importing Data with the Query Wizard
Step 1: Configuring a Data Source through ODBC
A System Data Source Name (DSN) is automatically created when you install and configure the LabVIEW DSC Module. Any data that you have logged using the LabVIEW DSC module is located in the database specified in the project library properties.
Step 2: Understanding Citadel 5 Data Storage
Citadel logs data only when the data value has changed, not necessarily at a specified interval. Citadel 5 provides access to data in two ways: the IntData table and the RawData table. Query the IntData table to return interpolated data at a specified time interval. Perform a similar query on the RawData table to return data as it was actually logged into the database.
Step 3: Importing Data into Excel
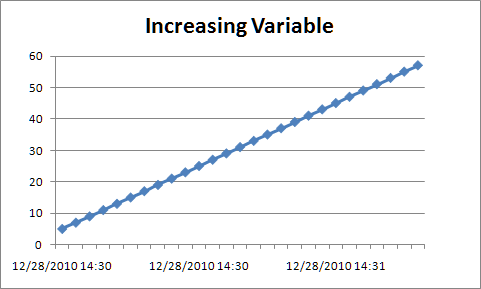
In this tutorial, you use the IntData table to generate a report of the time history of the process. This query provides data that is spaced evenly through time.
-
Open Microsoft Excel and create a new workbook.
-
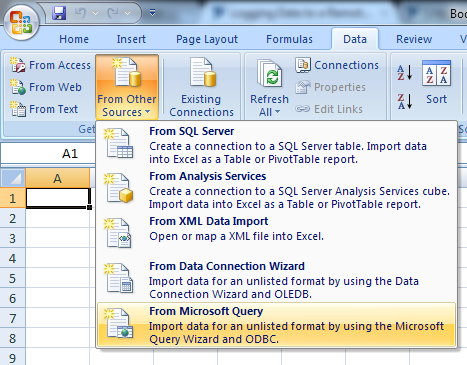
Select the Data tab, and under the Get External Data group select From Other Sources»From Microsoft Query, as shown in the following figure.
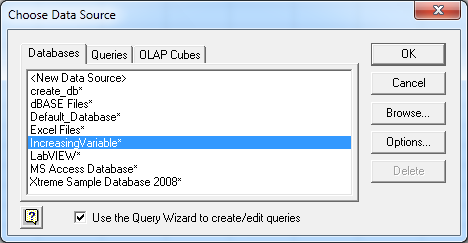
- Select the DSN that you want to connect to. The following figure shows how you select the data source. If you are using the DSC Module, the default DSN name is Default_Database*. For this example we will be selecting the IncreasingVariable* DSN. If your DSN does not show up on the Choose Data Source window, please confirm you are using the 32-bit version of Excel and follow Setting up a Citadel Database as an ODBC Data Source for LabVIEW DSC to set up the data source.
-
Click the OK button. The Query Wizard appears and lists the different ways you can access data stored in the Citadel database.
-
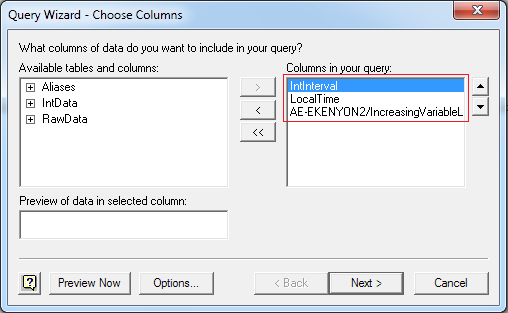
From the IntData table, select the following three data items: IntInterval, LocalTime, and the tag of the data item you want to import, as shown in the following figure. Click the Next button.
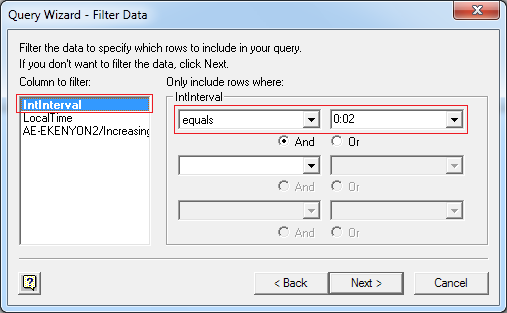
- Now you need to configure the time interpolation value for the query. Select IntInterval and set equals to 0:30, as shown in the following figure, which returns a value for the selected data item from Citadel at an interval of 30 seconds. If you want to retrieve data at 10 minute intervals, set equals to 10:00
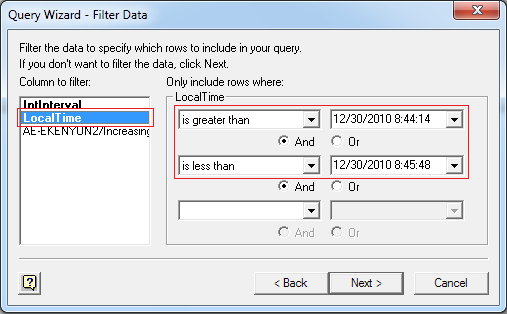
You also can configure a specific date/time range, where the date/time format is specific to your computer. However, if you configure a specific date/time range, you cannot use the Query Wizard to modify the query at a later time. The following figure shows how you can set a specific date/time range using the LocalTime column.
-
Click the Next button after you finish configuring the filter options.
-
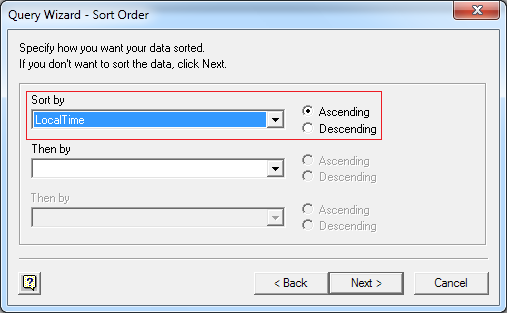
Specify the sort order for the data by selecting "Local Time" and Ascending. Click the Next button.
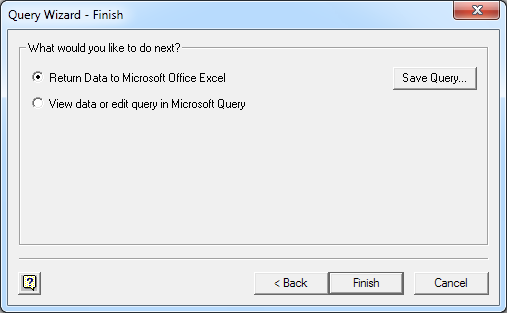
- The Query Wizard now asks if you want to return data to Excel or continue into Microsoft Query. Select Return Data to Microsoft Office Excel to import the query directly into Excel. Click the Finish button.
- Finally, select how you want to view the data and where to put the data and click OK. The data is now in an Excel table where it can easily be displayed on a chart.
- If you need to modify the query after importing the data into Excel, select the Data tab. Under the Connections group, select Connections. This will bring up all the connections in your workbook. Select the Query you would like to edit and select Properties… This brings up the “Connection Properites” dialog box. Select the Definition tab and select Edit Query…
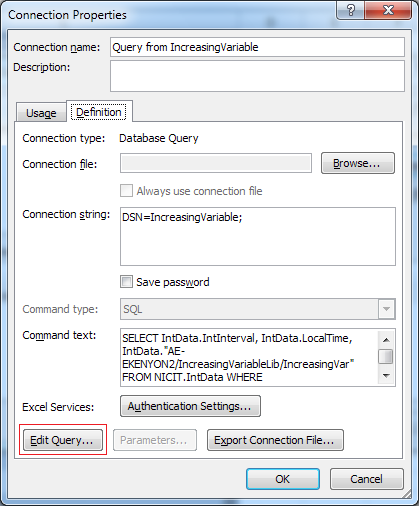
Notice also that the “Command text” is available from this dialog box.
Remember that if you added a date range to the query, as in this example, you cannot edit the query using the Query Wizard.
Advanced – Using PivotTables to View Data
PivotTables are a powerful tool you can use to automatically generate tables and charts based on data stored in a database. You can use PivotTables to view data stored in a Citadel database and to easily display data for a given date range or average values over time.
Note: PivotTables are an advanced and extremely customizable tool. Refer to the Microsoft Help for information about customizing a PivotTable. You also can find relevant examples on the Microsoft Web site.
Step 1: Configuring a PivotTable in Excel
-
Open a new worksheet in the Excel workbook in which you inserted the table.
-
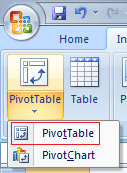
Select the Insert tab, and under the Tables group select PivotTable»PivotTable.
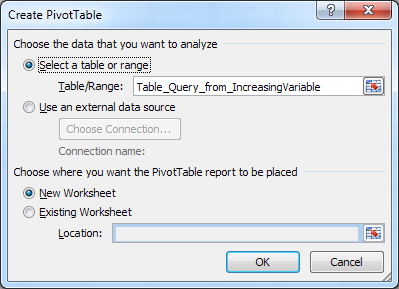
- To use the data you imported in the previous example, choose Select a table or range. Alternatively, you may choose the connection you established earlier by selecting Use an external data source. In this example, we will use the table we already imported and insert it into a new worksheet by selecting New Worksheet.
-
Click the OK.
-
A PivotTable will appear on a new sheet. Click on the PivotTable to configure the PivotTable. A PivotTable Field List will appear on the right. For the PivotTable in this example, drag LocalTime in the Row Labels box and the relevant data into the Values box. The worksheet should look like the following figure.

-
The default for the Values field is sum. To change this, click on the data in the Values box and select Value Field Settings…
-
Drag and drop the fields into the appropriate areas to configure your PivotTable.
Note When you create a PivotTable, Excel copies the data from the data source into the PivotTable. If the data changes, you need to update the data by right-clicking on the PivotTable and selecting Refresh Data from the shortcut menu. Updating the data might take a significant amount of time if you have a lot of data points to import. To decrease the update time, try modifying the query to reduce the amount of data you return.
Step 2: Creating a PivotChart
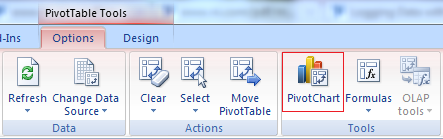
- To create a PivotChart from the data in our PivotTable, select the Options tab, and under the Tools group select PivotChart.
-
Select a line graph as they type of chart you wish to add and click OK.
-
Select a line graph because line graphs work best for trend lines, and click the OK button.
-
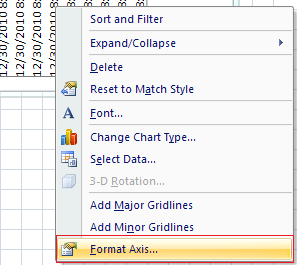
You can configure the x-axis so it does not have too many markers by right-clicking the axis text and selecting Format Axis from the shortcut menu, as shown in the following figure.
-
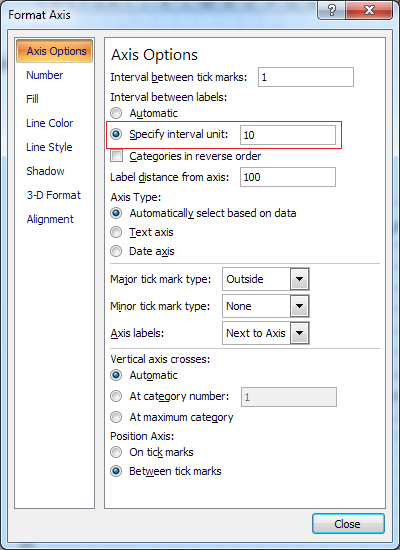
Configure the axis only show one out of every ten labels as in the figure below .
- Click the Close button. You should have a chart like the one below. You have completed importing data from a Citadel 5 database into Excel.