Create a Dashboard
- Open Data Dashboard on your device. You will see the main view dashboard carousel, where you can manage your dashboards.
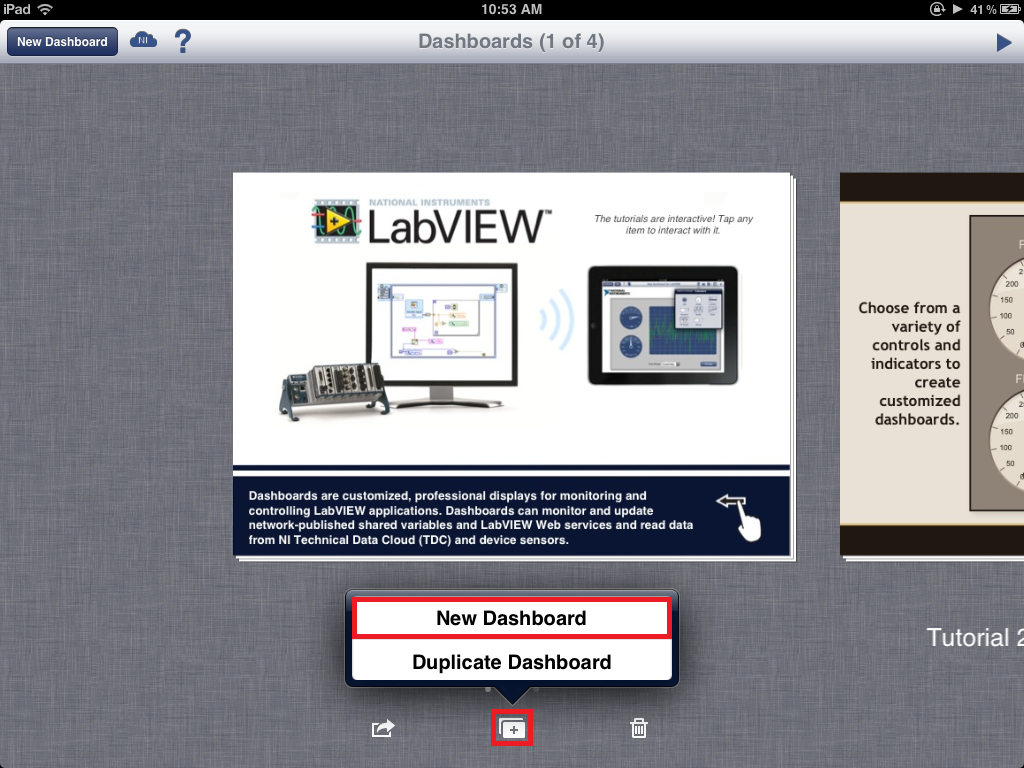
- Tap the + sign at the bottom of the carousel and select New Dashboard.
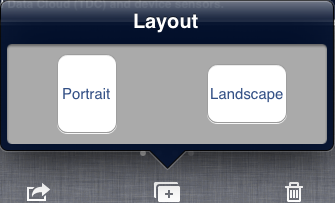
- Choose the orientation of your dashboard, Portrait or Landscape. For this guide, you can select either option.
Your new dashboard will open and appear.
- Tap the Controls and Indicators Icon and select Indicators. This will open the indicators palette.
- To place an indicator on the dashboard, tap the desired indicator, then tap where you want to place it on the page. For this example, drag a Chart and a Numeric on to the dashboard.
Deploy Shared Variables
Before you can link your dashboard controls and indicators, you need to have variables to connect to. If you already have a network-published shared variable deployed, you can move to the Connect to Shared Variables section. To deploy network-published shared variables you will need to create a project in LabVIEW.
- In LabVIEW, select File>>New Project to create a new LabVIEW project.
- Right-click My Computer in the Project Explorer window and select New>>Variable.
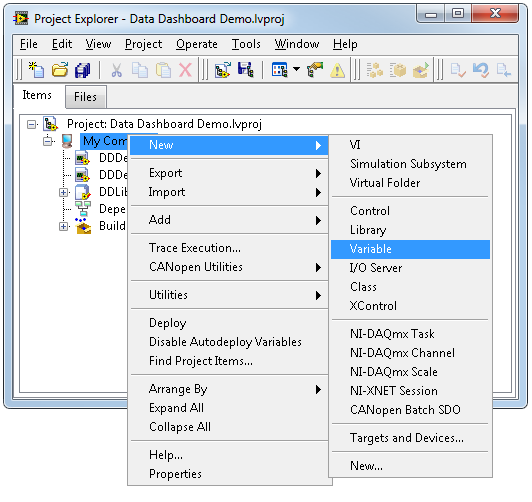
- Right-click the shared variable and select Rename. Rename the shared variable DDVariable1.
- Right-click My Computer and select New>>VI to create a new VI and add it to the project. This VI will periodically update the shared variable value with a random number.
- Save the project.
- Add a While Loop to the Block diagram of the VI.
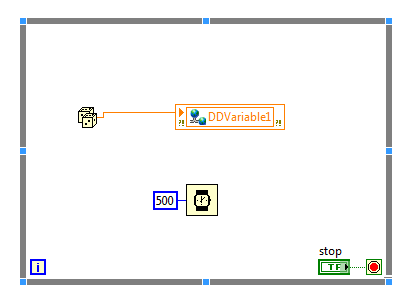
- Place a Random Number (0-1) function and a Wait (ms) function inside the While Loop.
- Right-click the input terminal of the Wait (ms) function and select Create>>Constant. Set the value of the constant to 500 to update the value every half second.
- Drag the shared variable you created from the Project Explorer window onto the block diagram. Right-click on the shared variable and select Access Mode>>Write.
- Wire the output terminal of the Random Number (0-1) function to the input terminal of the shared variable.
- Right-click the input terminal of the stop terminal and select Create>>Control, to create a button for stopping and starting the program. Your block diagram should resemble the following example.
- You must deploy the shared variable before you can display its value in the Data Dashboard. In the Project Explorer window, right-click the project library that contains the shared variable and select Deploy.
- Run the application to continuously update the shared variable.
Connect to Shared Variables
Now that you have placed your indicators and deployed your network-published shared variables, you can link your dashboard to your shared variables.
- In Data Dashboard, tap the Chart indicator and select the Data Link icon. This will open the Connect dialog.
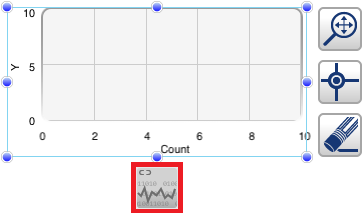
- Select Shared Variables in the Connect dialog. Enter the Shared Variable server DNS or IP address as shown in the following image. In most cases, this will be your computer's IP address.
- Tap Connect to connect to the Shared Variable Engine.
- Tap the name of the library that contains the deployed shared variable. Select your shared variable, as shown below. The data type of each shared variable is listed below the variable name.
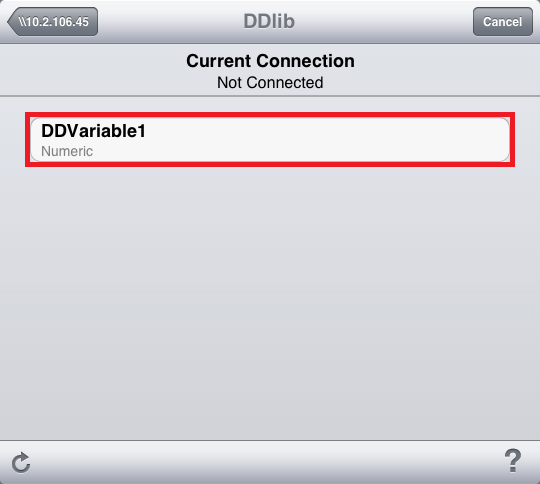
- Repeat steps 1-4 for your Numeric indicator. Data Dashboard only allows you to select shared variables that are compatible with the data type of the selected indicator. In this example, the deployed Shared Variable is a double-precision floating point number, which you can display using a Chart or Numeric indicator.
- You can customize the chart's appearance by selecting the properties menu shown below.
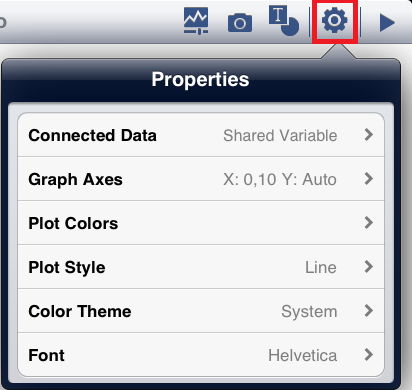
- Run the dashboard by selecting Play in the upper right hand corner. The running dashboard should appear similar to the following image.
Deploy Web Services in LabVIEW
In this section of the guide, you will be creating a Web Service and a web method to connect your Data Dashboard. The following steps describe the process of building a Web Service with LabVIEW 2013 and later.
- Create a new LabVIEW project.
- Name the project Data Dashboard Demo.
- Right-click My Computer and select New»Web Service. LabVIEW adds a Web Service project item and folders under the target.
- Right-click the Web Service project item and select Rename. Name the Web Service DataDashboardDemo.
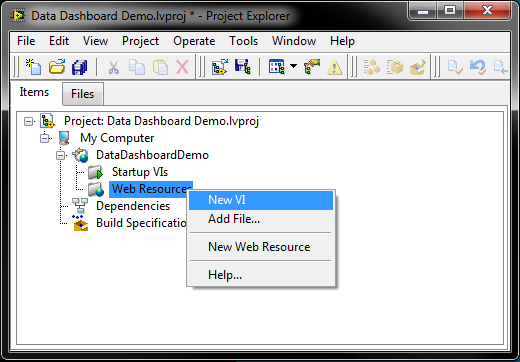
- Right-click Web Resources and select New VI to create a new HTTP method VI. LabVIEW will open a new VI from a template.
- Place a Random Number (0-1) function on the block diagram.
- Right-click on the output terminal of the Random Number (0-1) function and select Create>>Indicator.
- Edit the indicator label and rename the indicator as DDVariable1, as shown in the following image.
- Assign the indicator to a connector pane terminal for the VI so that Data Dashboard can monitor the output of the web method VI.
- On the front panel, click a terminal of the connector pane. The terminal turns black.
- Click the DDVariable1 indicator on the front panel. A marquee highlights the indicator and the terminal changes to the data type color to indicate you connected the terminal, as shown below.
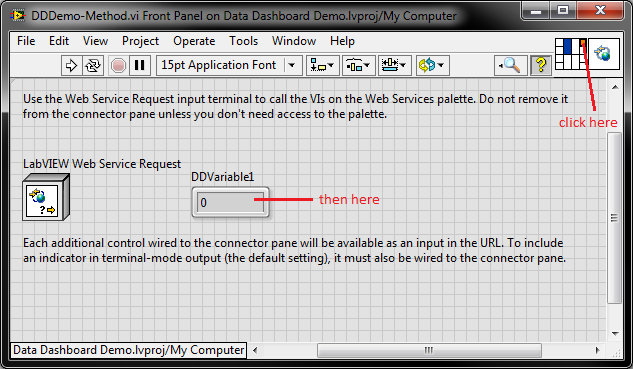
- Save the VI as DDDemo-Method.vi.
- Right-click on the DataDashboardDemo Web Service in the Project Explorer window and select Application Web Server»Publish to publish the Web Service application. The Deployment Progress dialog box appears.
- When the Web Service publishes successfully, close the dialog box.
Connect to Web Services
Now that you have placed down your indicators and deployed your Web Service, you can link your dashboard indicators to your Web methods. There are two ways to connect to a Web method, polling and calling. Polling a Web method calls the Web method continuously every .3 to 30 seconds as specified by the user. Calling a Web method only calls the Web method when the Call button is pressed. For this guide, we will use a polling connection to continuously populate the data on our chart and indicator.
- In Data Dashboard, tap the Controls and Indicators icon and select LabVIEW Web Services.
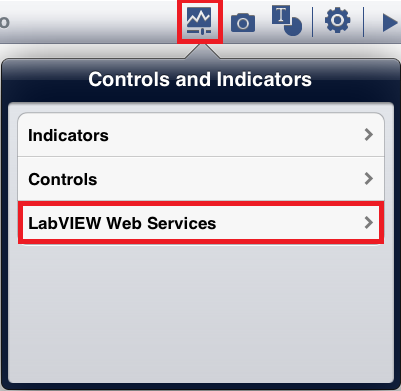
- Add a Poll Web Service to the dashboard and select the Web Link icon.
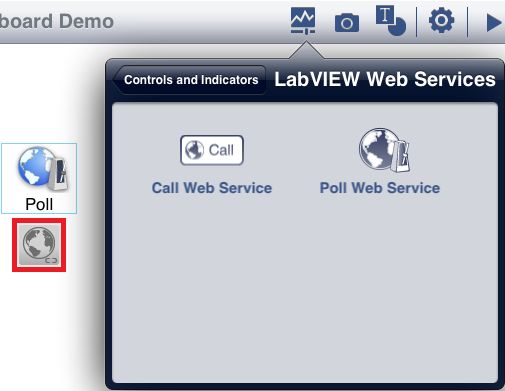
- The Web Services connection dialog will open and you will be able to enter the server DNS or IP address, and Port of your Web Service. Tap Connect.
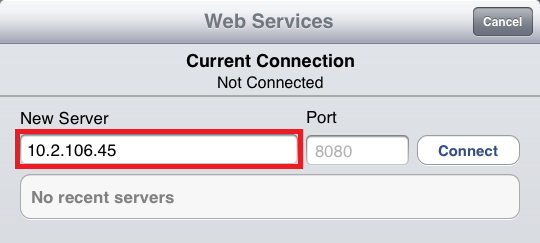
- You will see a display of Web Services hosted on your target. Choose your Web Service and the Web Method you want to link to your poll.
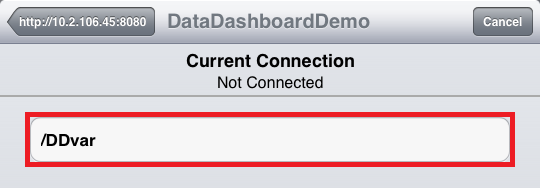
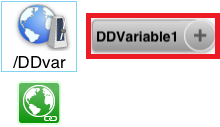
- When the Web method connects successfully, you will see the Web Link icon turn green. To link your Poll to an indicator, select the name of the variable you want to link.
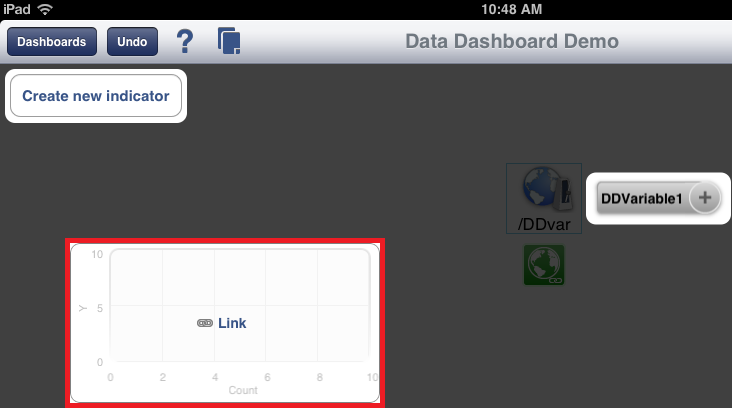
- You will now see an overlay that shows you which indicators on the dashboard that you can link to your variable. Tap the Chart to link the Web method variable to the chart indicator. You can also choose to create a new indicator from the overlay.
- When you finish linking your Web method variable, you will see the mappings as shown below.
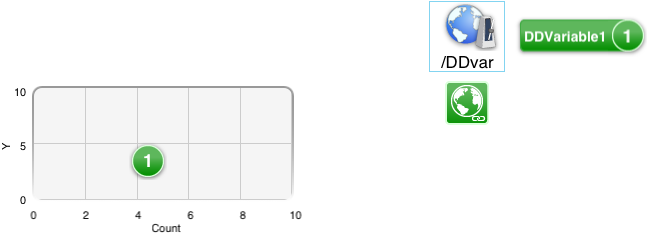
- Repeat steps 1-7 to link your Numeric indicator to your Web method. Run your dashboard. The running dashboard should appear similar to the following image.
