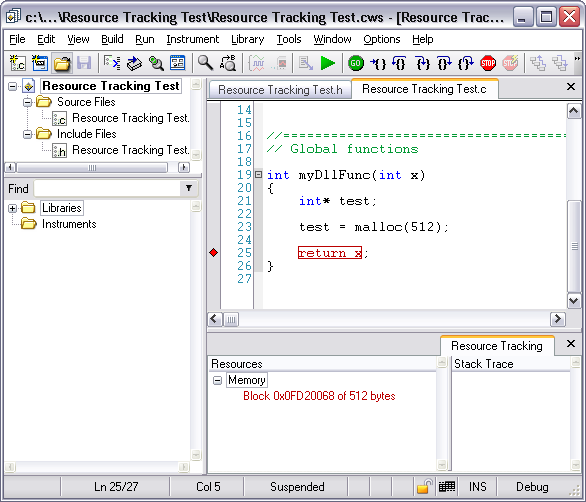
Enabling Resource Tracking in CVI
You must enable Resource Tracking in CVI in order for the Resource Tracking Window to display the allocation and deallocation of memory. Resource Tracking can be enabled in two ways. You can enable Resource Tracking for all code run in the CVI environment using the Extended Debugging level. This can be configured in the Build Options dialog box (Options»Build), by setting the Debugging level to Extended. If you do not want to track resources for all code run in the CVI environment, you may set the Debugging level to Standard, and then use the SetEnableResourceTracking() function in your CVI code to enable Resource Tracking for a section of your code.
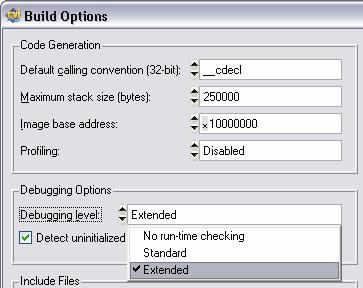
Resource Tracking only updates when debugging is suspended or completed. Therefore, you will only get updated information at the end of a debugging session, or if you are suspended at a breakpoint in your code. To use the Resource Tracking Window when calling CVI code modules from TestStand, you must use the CVI environment to debug the code modules called from TestStand as described in the following section.
Using the CVI Environment to Launch the TestStand Sequence Editor
This process consists of configuring the CVI Development Environment to launch the TestStand Sequence Editor as its executable when debugging your CVI code.
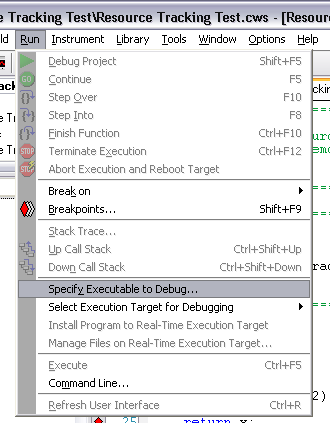
In the CVI environment, open your project that contains the code for the code modules you will be calling from TestStand. Ensure that Resource Tracking is enabled using one of the two methods described above. From the Run menu, select Specify Executable to Debug... and navigate to the version of the Sequence Editor that is currently active (<TestStand>\Bin\SeqEdit.exe). Then, use CVI to launch the Sequence Editor by clicking the debug arrow.
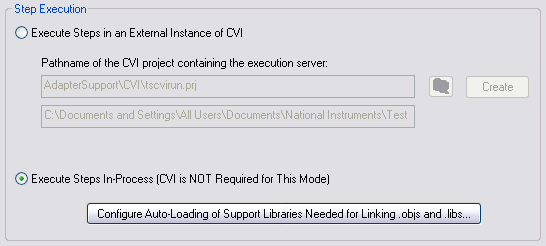
Once CVI has launched the Sequence Editor, first confirm that the CVI Adapter Settings are configured to run CVI code modules in an internal process. Check the Adapter Settings by going to Configure»Adapters... Select LabWindows/CVI and click Configure... Ensure that the Step Execution settings are set to Execute Steps In-Process. Once you have confirmed this, load your sequence file and run it.
Once your sequence has executed, you can close the Sequence Editor to complete the CVI execution. If any objects were leaked, the Resource Tracking window will appear in CVI with information about the leaked objects.
Advanced Debugging in CVI with TestStand
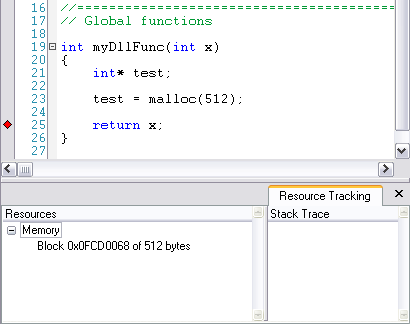
In addition to monitoring leaked objects after execution has completed, you can also see an up-to-date representation of resources in memory using breakpoints. If your CVI project has breakpoints, they will be honored when running your sequence in this manner. You can also set a breakpoint in TestStand and Step Into your CVI code module if your project does not have breakpoints. Once debugging is suspended in CVI, you can open the Resource Tracking window (Windows»Resource Tracking) and see the resources that are in use by your code.
