Install Software
Before you begin automating VirtualBench in LabVIEW, make sure you have installed the appropriate software.
-
If you have not already installed LabVIEW, download and install a free LabVIEW evaluation.
-
Download and install the VirtualBench driver.
Communicating With VirtualBench in LabVIEW
With LabVIEW, you can automate VirtualBench and analyze, display, and record your results in a single development environment. Driver software makes this connectivity possible by serving as the communication layer between LabVIEW and VirtualBench.
Application Programming Interface
The VirtualBench driver consists of two key components: a device driver and the instrument application programming interface (API). The device driver works with the computer OS to establish communication between the computer and VirtualBench. An instrument API is a set of high-level, easy-to-understand functions that are used in LabVIEW to control and communicate with an instrument. This means you can focus on setting up your measurement and getting the right data, without having to manually manage exactly how measurement data is transferred back to the program.
VirtualBench API in LabVIEW
The VirtualBench API natively integrates into LabVIEW upon driver installation, which provides a palette for easy access to functions. In LabVIEW, these are called VIs. You simply drag and drop the VIs to your block diagram to configure and control the VirtualBench instruments. The VirtualBench palette contains five instrument APIs, one for each instrument as well as utility VIs. They are located on the Functions Palette under Measurement I/O then VirtualBench.
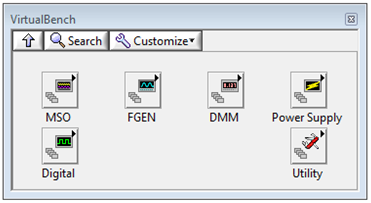
Figure 1. The VirtualBench palette includes five instrument APIs, one for each instrument.
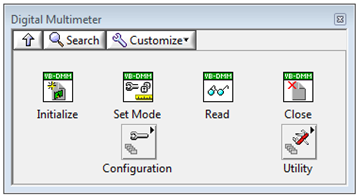
Figure 2. Drag and drop the instrument’s functions to program VirtualBench.
Understanding VirtualBench VIs
LabVIEW includes a tool called Context Help that provides programming information about a VI quickly and easily. To open Context Help, press <Ctrl-h> to bring up the window and then hold your cursor over a VI on your block diagram to see a description of that VI and the parameters it uses.
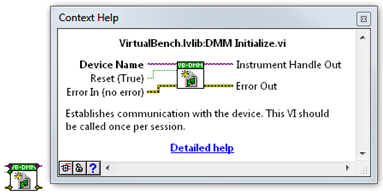
Figure 3. LabVIEW provides in-product help documentation that quickly provides information on VIs and other objects.
VirtualBench Driver Model
Most hardware APIs in LabVIEW follow the same programming model. This simplifies migration to newer instruments or integration into existing systems by eliminating the need to learn an entirely new communication method for new instruments.
The VirtualBench hardware driver model consists of five main steps:
-
Initialize a Session: Establish communication with a particular instrument.
-
Configure the Instrument: Specify instrument settings such as the range on the digital multimeter (DMM) or set up a trigger for the mixed-signal oscilloscope (MSO).
-
Perform an Operation: Specify an operation to perform, typically a read or write.
-
Close the Session: Release the instrument for future calls.
-
Handle Errors: Specify a way to account for errors that may have occurred.

Figure 4. Hardware APIs follow the same hardware driver model; this simplifies the transition to new instruments by eliminating the need to learn new protocols.
Automating VirtualBench Instruments
Each VirtualBench instrument follows the hardware driver model described above in Figure 4. Figure 5 below shows a program using the VirtualBench DMM. The program executes from left to right; this data flow is controlled by the wires.

Figure 5. Programming in a graphical API increases understanding of the code at a glance.
Initialize a Session
The first step is to initialize a session with the VirtualBench instrument. Each instrument should be initialized only once in each program. The device name, or the particular VirtualBench that will be used, is inputted into the initialize VI. Inputs are on the left of a VI and outputs are on the right. If an input requires the user to provide a value on the front panel, it is referred to as a control. The VirtualBench Device control is a pull-down menu that displays only devices that can be selected, making it easy to select the correct device.
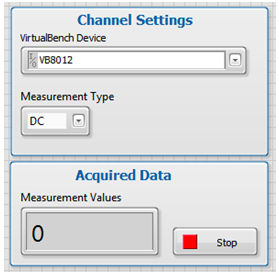
Figure 6. You can customize front panels to provide the best user experience for your application.
Configure Instrument
After the acquisition has been initialized, the instrument is then configured for the measurement. Note that the instrument information and the error information from the Initialize VI are passed to the next VI; this is what tells subsequent VIs which instrument to use, passes along relevant error information to the next part of the application, and enforces data flow.
In the program on Figure 5, the DMM function needs to be selected. This control, like most configuration controls, provides a pull-down menu showing only the allowable inputs. This is true for most inputs, eliminating the need to remember what options are available or what syntax is required so you can focus on taking the measurement.
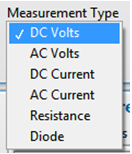
Figure 7. With the use of pull-down menus, there is no need to memorize the input options or their syntax.
Setting the function is an example of configuring the channel. Other examples include specifying the output voltage of the power supply or the frequency and amplitude of a signal for the function generator. After setting up the channel, you should then configure the timing if needed such as specifying the sample rate on the MSO. Lastly, configure the trigger if you will be using one. Context Help can assist you in determining which settings you can configure.
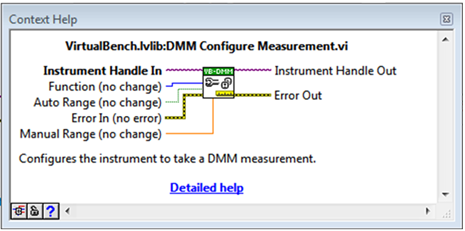
Figure 8. Context Help quickly provides information to assist you in programming.
If an input is bolded, then that input is required. If an input is not required, you may choose whether to wire an input. The value indicated in parenthesis is the default value; if no input is wired, the input defaults to this value. A default value of “no change” means the setting information will be pulled from the device and will use the configuration that was last set on the device. When a program is complete, the instrument settings that were changed then become the last state configured. The Windows application displays all current settings on the device.
Perform Operation
The next step is performing the operation—the actual read or write step. In the program on Figure 5, the operation is inside a While Loop. The loop lets you repeat a section of code. Without it, the program would run only once, meaning it would read one sample and then end. In the bottom right of the loop is the stop terminal; in this case, the While Loop stops when there is an error in the program or when the user clicks the Stop button on the front panel. This is the most common behavior for stopping a While Loop.
The DMM Read VI outputs the measurement value to an indicator on the front panel. For this program, it displays simply a value. However, indicators can also be graphs, charts, or LEDs. Operations can also be performed on the data before displaying it; this ensures that the information displayed is meaningful to the user right away. For instance, rather than plotting the raw data, analysis like a frequency domain transfer can be added so the graph displays a Bode plot.
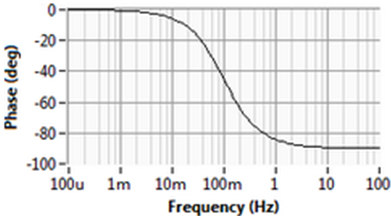
Figure 9. In-program analysis surfaces meaningful results right away; increase comprehension by customizing the appearance.
Close Session and Handle Errors
After the operation is performed, the session is closed. Similar to initializing an instrument, each instrument session should be closed only once per program. Finally, all errors should then be handled appropriately. Most programs display a dialog box informing the user of any errors.
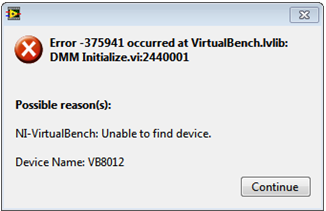
Figure 10. Handle errors to assist the user with troubleshooting.
Automating Multiple Instruments
VirtualBench consists of multiple instruments that can act independently. For instance, the function generator (FGEN) can be automated to run a particular sequence while a user interacts with the MSO to view the result on the Windows application. Each instrument can be called in different VIs and the VIs can run simultaneously. This can be helpful in debugging.
Multiple VirtualBench Instruments
For complicated tests, it can be cumbersome to create multiple VIs to work with multiple instruments. Multiple VirtualBench instruments can be automated in the same VI. Each instrument needs to go through every step of the driver model except for handling errors. You should handle all errors at the same time. In addition, you should use wires to enforce data flow. In the snapshot below, for instance, the FGEN wire goes through the MSO While Loop to make sure the FGEN is running before the MSO starts reading. Then, all errors from both instruments are bundled together and handled at the same time, ensuring that all errors are captured and displayed.
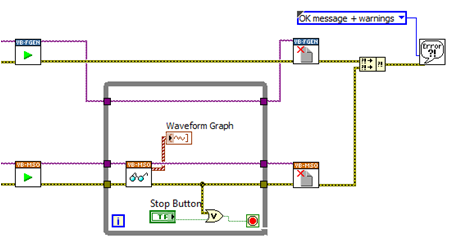
Figure 11. Use error wires to enforce data flow to coordinate your instruments.
Multiple Benchtop Instruments
Certain tests require the use of instruments outside of VirtualBench. Using LabVIEW, you can automate VirtualBench and stand-alone instruments from a single application. Stand-alone instrument drivers are at Instrument Driver Network (IDNet). The NI certified drivers follow the same instrument driver model discussed earlier, and look and feel similar to the VirtualBench API. In the rare event that a LabVIEW driver doesn’t exist, you also can import drivers from other programming languages or use low-level communication to implement your own driver.