Solution
Locating the Sample Timing InformationThe spreadsheet should not contain time stamps for each individual sample under the various tabs for measurement groups. If time-stamped data was streamed to a TDMS file, then the information needed to calculate all of the time stamps can be found on the first tab of the spreadsheet when the TDMS file is opened in Microsoft Excel. The values needed to calculate the time stamps are '
wf_increment', '
wf_start_offset', and '
wf_start_time'. (See the screenshot, below.)
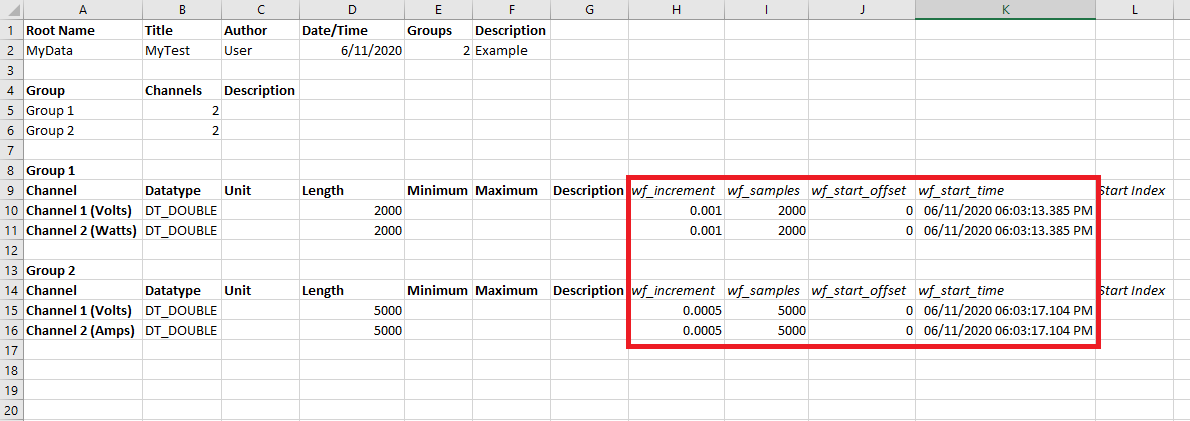
The data is presented in this manner to reduce the size of the TDMS file. If the time stamps were stored as values on each measurement group tab, then the TDMS file would take up multiple times more data on disk.
How to calculate timestamps relative to measurement start timeTo calculate the relative time stamp for each data point, we can use the following equation:
time_relative =
'wf_start_offset' + 'wf_increment' x [sample number]
Example: When calculating the relative time stamps for 'Channel 1' in 'Group 1' from the example TDMS file screenshot above, we would get the following results.
- Sample 0 (cell A2 in first screenshot) - 0.000 seconds
- Sample 1 (cell A3 in first screenshot) - 0.001 seconds
- Sample 2 (cell A4 in first screenshot) - 0.002 seconds
- And so on. (A unique value can be calculated for every sample from the measurement channel.)
How to calculate timestamps with absolute measurement timeTo calculate the absolute time at which each data point was measured, we can use the following equation:
time_absolute =
'wf_start_time' + 'wf_increment' x [sample number]
Example: When calculating the absolute time stamps for 'Channel 1' in 'Group 1' from the example TDMS file screenshot above, we would get the following results.
- Sample 0 (cell A2 in first screenshot) - 6/11/2020 6:03:13.385 PM
- Sample 1 (cell A3 in first screenshot) - 6/11/2020 6:03:13.386 PM
- Sample 2 (cell A4 in first screenshot) - 6/11/2020 6:03:13.387 PM
- And so on. (A unique value can be calculated for every sample from the measurement channel.)