Solution
These are the commonly used in RF unit conversion formula:
Vpk = sqrt(I+Q)Vrms = Vpk / sqrt(2)Powerwatts = Vrms2 / ZohmsPowerdBW = 10 * log(Powerwatts)PowerdBm = PowerdBW + 30PowerdBmV = PowerdBm + 10 * log(100 * Zohms)PowerdBm = PSDdBm/Hz + 10 * log(BWHz)
Where,
Zohms represents the input impedance of the device,
BWHz represents the bandwidth range of user interest, and
PSDdBm/Hz represents the power spectral density.
The following below shown the example of scenario using RF unit conversion formula:
1. Conversion from Volts to dBm
Single-tone signal generated by vector signal transceiver (VST) has a frequency offset of 500 kHz from the carrier, IQ signal generated at a rate of 120 MS/s and output power is about -20 dBm. The signal is fed back to the VST device via the RF IN port. The I/Q level measurement results are shown in Figure 1 below, and the power measurement results are shown in Figure 2.
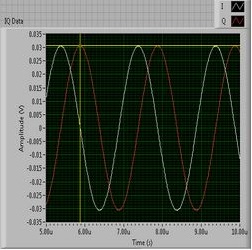 Figure 1. I/Q Level Measurement Results
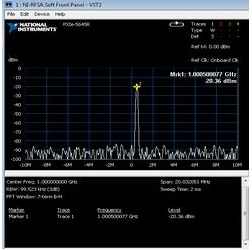 Figure 2. Power Measurement Results
Based on the I/Q level measurement results, the signal power can be calculated by the following formula:
I = Vpk * cos(theta(t)) = 0.03 * cos(theta(t))
Vpk = 0.03 V
Vrms = Vpk / sqrt(2) = 0.03 / sqrt(2) = 0.021213 V
Power = Vrms2 / Zohms
PowerdBm = 10 * log(Power) + 30 = 10 * log(9u) +30 = -20.45 dBm
or
PowerdBm = 20 * log(Vpk) + 10 = 20 * log(0.03) +10 = -20.45 dBm
From the above conversion equation, we can find out that the time domain measurement results of signal power are basically consistent with the frequency domain calculation results.
2. Conversion from dBm/Hz to dBm
Spectrum measurements captured using the NI VST are shown in Figure 3. The power spectral density at marker 1 is -84.50 dBm/Hz.
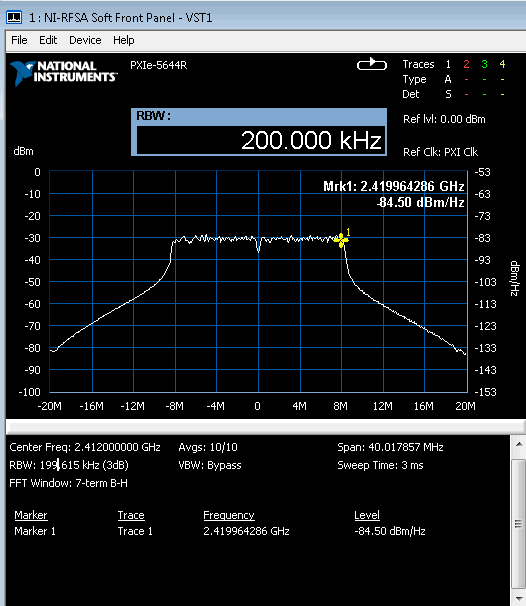 Figure 3. Spectrum measurements captured using NI VST
At a resolution bandwidth of 200 kHz, the signal power can be calculated as follows:
P
dBm = PSD
dBm/Hz + 10 * log(BW
Hz) = -84.50 + 10 * log(2 * 10
5) = -31.4 dBm