Check Loop Execution Rate
Loop execution rate refers to the amount of time that is required to execute one iteration of your application’s main loop; eg can my application read 10 analog inputs in 100 m? To measure loop execution time, see the Example Finder > Toolkits and Modules > Real-Time > Benchmarking > Benchmark Project example include with the LabVIEW Real-Time Module. Loop execution rate is highly correlated to CPU and memory usage, and these measurements are addressed in the next sections.
Check CPU Usage
The CPU usage is an important performance metric to monitor when evaluating application performance.
To measure CPU usage on LinuxRT, you can use common Linux tools such as top or htop or NI tools.
Check Application Throughput, Jitter and Latency
For an example of jitter measurement, see the RT Analysis Workspace example include with the LabVIEW Real-Time Module. While the general application-level benchmarks show comparable performance, we recommend profiling your application for jitter and latency if your application is sensitive to these metrics.
Check Memory Usage
Memory management and reporting on Linux devices differs significantly from targets running operating systems such as Windows or PharLap.
Check Network and Disk Throughput
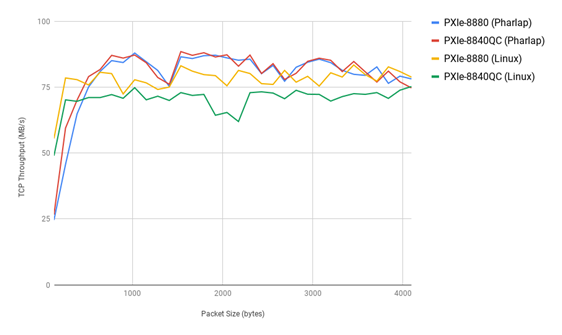
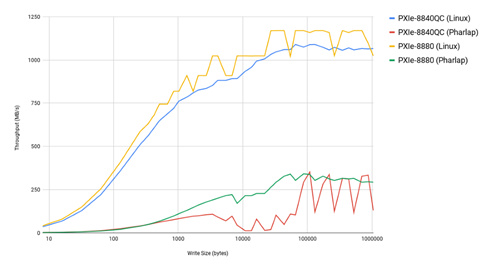
As noted in the overview, NI LinuxRT Ethernet and disk throughputs are significantly improved from Pharlap. See below for sample test results from NI performance benchmark tests.

Figure 1: Comparison of network throughput test running on LinuxRT versus PharLap

Figure 2: Comparison of disk write throughput test running on LinuxRT versus PharLap