While it is possible to increase the Chart History Length manually before the program runs, there is actually no way to increase the Chart History Length programmatically. If you know the maximum possible number of historical points, you can set the number of visible history points.
Set the current values displayed on your waveform chart with these two property nodes:
- X Scale » Range » Maximum
- X Scale » Range » Minimum
The x-axis represents the index of elements in the chart's history. To limit how many points are shown, you can set the maximum to the most recent index, subtract your desired number of values, and set this as the minimum. You can see this process in the attached Chart Display Size VI.
Note: This does not alter the data stored in the chart data buffer, only which data is displayed on the chart.
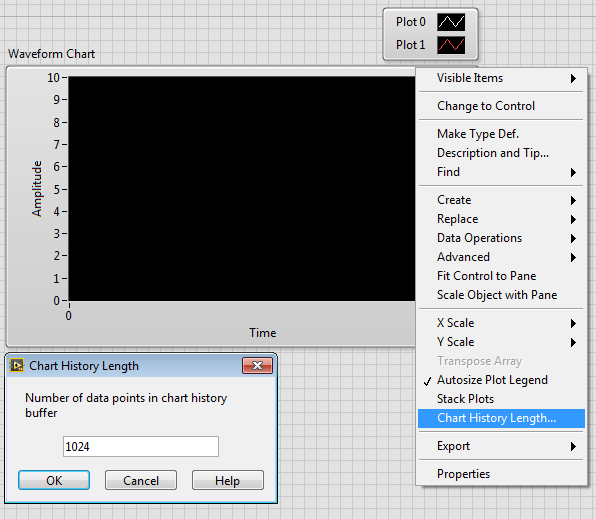
Alternatively, you can increase the number of data points in the chart history buffer prior to running the program.
- Right-click the chart on the Front Panel
- Click Chart History Length
- Increase or decrease the number of data points to be stored in the chart history buffer in the Chart History Length pop-up window
Additional Information
The reason why there is no way to increase the Chart History Length programmatically is because LabVIEW allocates memory to the chart before the program is executed and there is no way to allocate more memory programmatically upon execution.