Each version of LabVIEW has property nodes to programmatically format the X-axis and Y-axis. These property nodes are not found in the same location for various versions of LabVIEW. Please refer to the sections below to see where these property nodes can be found for specific versions of LabVIEW.
LabVIEW 8.5 and Later: Follow these steps to programmatically format the X-axis to display timestamp data:
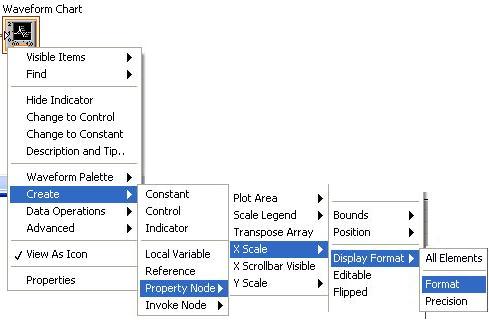
1. Right-click the icon representing the graph or chart on the Block Diagram and select
Create»Property Node»X Scale»Display Format»Format . The same path exists for the Y-axis as well
 2. Right-click
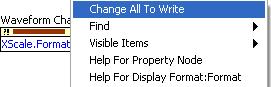
 the property node and select
Change All to Write.
 3. Right-click
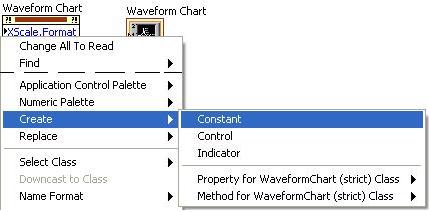
 the input terminal of the property node and select
Create»Constant.
 4.
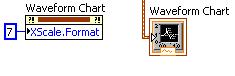
4. Change the value of the constant. This property accepts integer values between 0 and 9. Each value represents a different display format. The integer value 7 corresponds with the Time and Date formatting. The context help for this property node gives a details which integers correspond with which display formats.
 LabVIEW 6.x through LabVIEW 8.2.1:
The path to this property node is different for LabVIEW versions 6.x through 8.2.1. For these versions of LabVIEW, the property node can be found by navigating to
X Scale»Format and Precision»Format.LabVIEW 5.x:In versions of LabVIEW 5.0 and earlier, you can set the format of the scale for a graph or chart to be Time and Date using
Attribute Node, instead of a Property Node. The property to set the format of the scale is
X Scale Info»X Format and Precision»X Format. The context help for this property lists 7 options (0 through 6). There is also an 8th option that sets the format to Time and Date for timestamps. Wire a value of 7 for the Attribute Node to use the Time and Date display format which is different than the relative time display format.