In LabVIEW 2010 and later, there is built-in functionality to export your graph data to Excel.
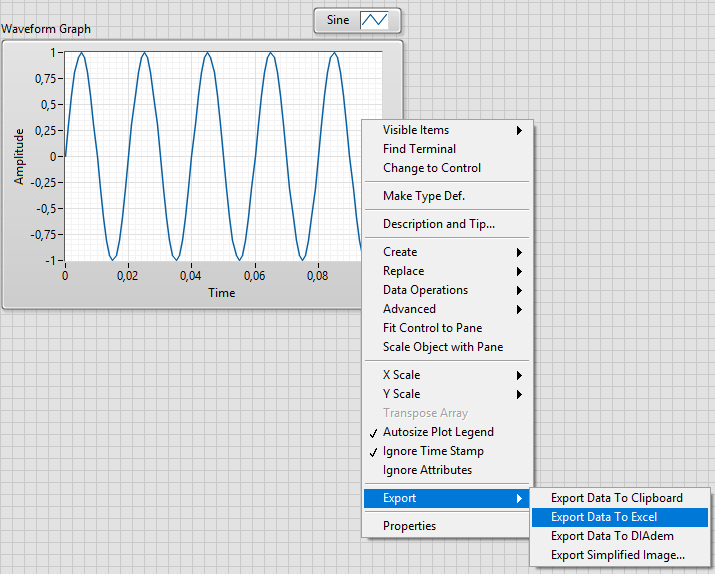
- Right click on the graph or chart.
- Choose Export»Export Data to Excel. (This will automatically open and populate an Excel worksheet with the exported data)
- Save the Excel workbook to your desired location.
In LabVIEW 2009 and earlier, there is no option to directly export your data to Excel. To export your data, follow these steps:
- Right click on the graph or chart.
- Choose Data Operations»Copy Data.
- Open a new VI by selecting File»New VI.
- Paste the data into the new VI by selecting Edit»Paste. A copy of your graph or chart should appear on the front panel of the new VI.
- On the block diagram of your new VI, change the graph or chart to a control by right clicking on it and selecting Change to Control.
- Now you can wire this control to any VI that will write to Excel. For example, you can use the Write to Spreadsheet File VI.
- Run the VI and your data will be exported to an Excel file.