On the Development Machine
- Check the Enable debugging option in the Advanced menu when creating the executable in the LabVIEW Application Builder.
- The Enable debugging option builds the block diagram into the executable so that you can follow its execution.
- The Wait for debugger on launch option means your executable will not run on launch and will wait for the debugger to connect. This option overrides the Run when opened property that you can set for every individual VI.
- If the target computer has newer versions of LabVIEW Runtime Engine than the LabVIEW version on the development machine, deselect Allow future versions of the LabVIEW Runtime to run this application. This will prevent the executable from using a newer Runtime version and not being detected by the development machine.
- Build the executable.
- Move the executable to the target machine along with all the associated files (application name.ini, application name.aliases and any other associated configuration files in LabVIEW 2009).
On the Target Machine
Skip this section if there is no firewall on the target machine.
- Grant an exception for the NI Service Locator in your firewall and open port 3580. If you do not have a firewall.
- Launch the executable on the target machine. If you have the Wait for debugger on launch option checked, the executable will launch but not run.
On the Development Machine
- In the Project Explorer toolbar, navigate to Operate » Debug Application or Shared Library... to launch the debugger.
- Enter either the Machine Name or the IP Address and click the Refresh button. This populates the Application or shared library drop-down box with all open debuggable applications on the selected target.
- Click the Connect button. This connects the debugger to the executable on the target and opens a window with the top-level VI in it.
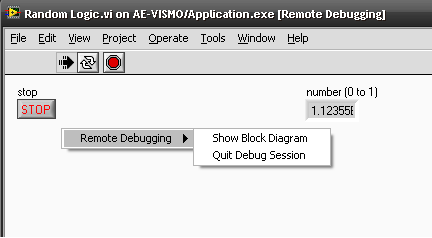
- You can access the block diagram from the Remote Debugging window:
- Right-click on the Front Panel to see the Remote Debugging menu that allows access to the block diagram.
- Select Window » Show Block Diagram. Now you have tools such as Highlight Execution, breakpoints, and probes available to you for debugging.
- Hover over the Front Panel and press <Ctrl-E> to open the block diagram.
You can use the
Quit Debug Session to stop debugging but leave the VI running on the target.
Additional Information
- Checking the Enable debugging option will automatically add DebugServerEnabled=TRUE to the .ini (configuration) file that is built with the application, regardless of whether you choose to use LabVIEW's default configuration file or your own custom .ini file (selectable with the Use the default LabVIEW Configuration file (LabVIEW.ini) checkbox on the Advanced menu). If you decide to use a custom .ini file in your project, LabVIEW will create a copy of the specified file with the DebugServerEnabled=TRUE token.
- In order to enable debugging for an application built in LabVIEW 8.0.x when specifying a custom .ini file, DebugServerEnabled=TRUE had to be manually added to the created .ini file in addition to selecting Enable debugging on the Advanced page of the Application Properties dialog in Application Builder. The same is true for the Wait for debugger on launch option and the corresponding ini string, DebugServerWaitOnLaunch=TRUE. This was fixed in LabVIEW 8.2.
- For instructions on creating an executable using the LabVIEW Application Builder, refer to Introduction to the LabVIEW Application Builder.
- Remote debugging will allow you to implement basic debugging tools such as highlight execution, probes, and step functions. For more information, see Debugging Tools in LabVIEW. You will not be able to directly modify the block diagram of an executable that you are debugging remotely.