For the simplicity, XY graph is used as an example to show how to add the cursor.
To add a cursor to the graph, follow the below steps:
-
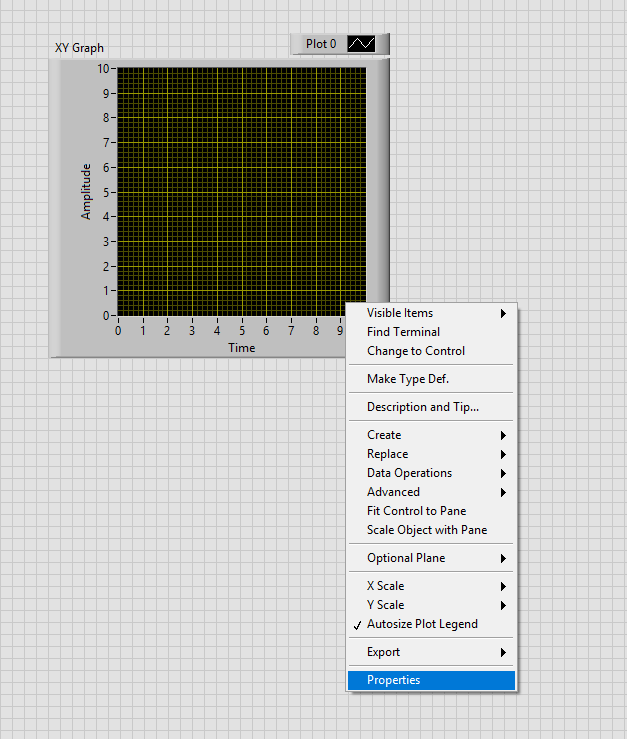
Right click on your graph.
-
Go to "Properties".
-
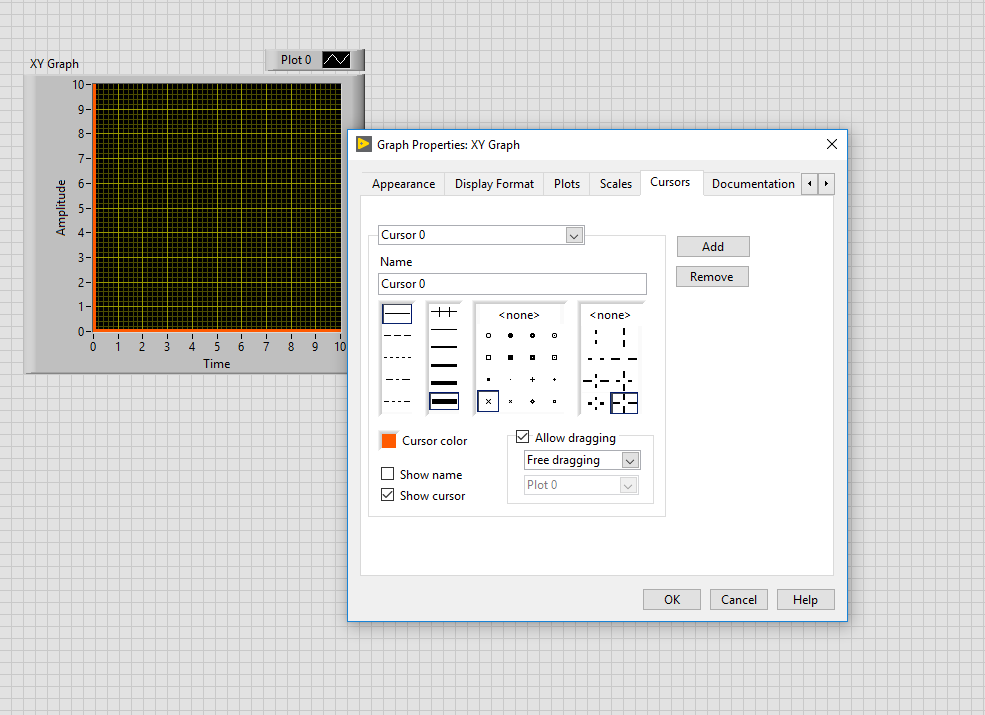
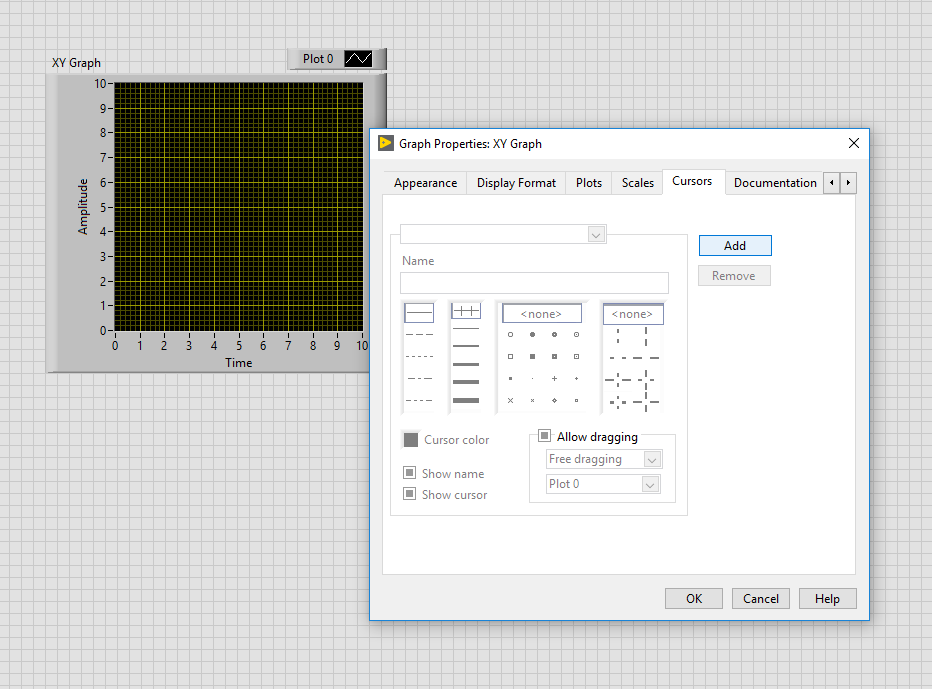
Select "Cursors" from the tab and click "add".
-
You can change the colour of the cursors and the line thickness in the pop up window, you can also allow free dragging to arrange the position of the cursors.