There are varying options to monitor CPU and memory usage on an NI Real-Time (RT) Controller. The amount of memory available depends on several factors, including the installed software and user application memory requirements.
This guide will walk through different methods of accessing this information from a Windows operating system:
- Programmatically using LabVIEW 2012 and Later
- Externally with Measurement & Automation Explorer (MAX) (Memory only)
- Externally with NI Distributed System Manager (DSM) (LabVIEW 2009 or Later)
- Externally with the Real-Time Trace Viewer
- LabVIEW versions 8.6.x and Earlier
For Linux Real-Time controllers, memory management and reporting differ from other Real-Time targets. Refer to the Memory Reporting Issue with NI Linux Real-Time OS Target for information on how to implement memory monitoring.
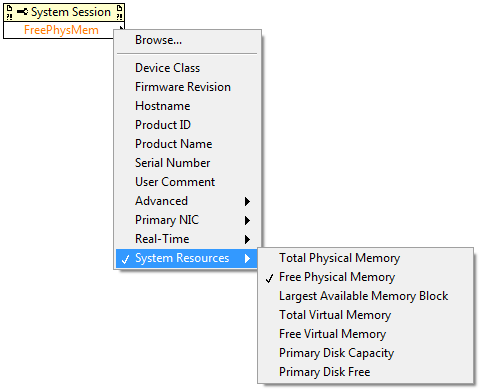
Programmatically with LabVIEW 2012 and Later:Using the System Configuration API, you can use the System Property Node get memory usage information using the
System Property Node to get memory usage information and the
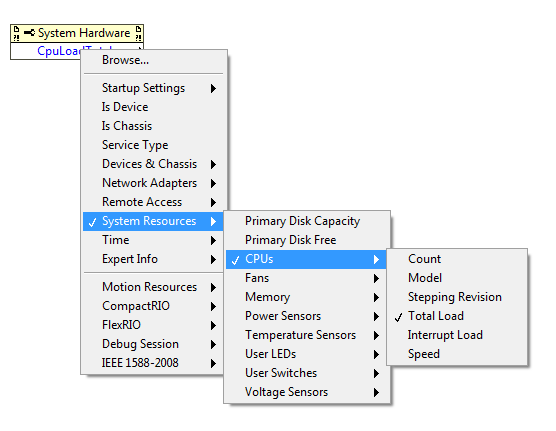
Hardware Property Node to get both memory and CPU usage details. For more information about how to use the Hardware and System Property Nodes, refer to the
Resource Monitor.vi example in LabVIEW by going to
Help >> Find Examples... and once the NI Example Finder loads, browsing to
Hardware Input and Output >> System Configuration.
 Externally with Measurement & Automation Explorer (MAX) (Memory only):
- Open MAX. You can do this by selecting Start»Programs»National Instruments»Measurement & Automation.
- Expand Remote Systems in the Configuration window.
- Select your real-time controller.
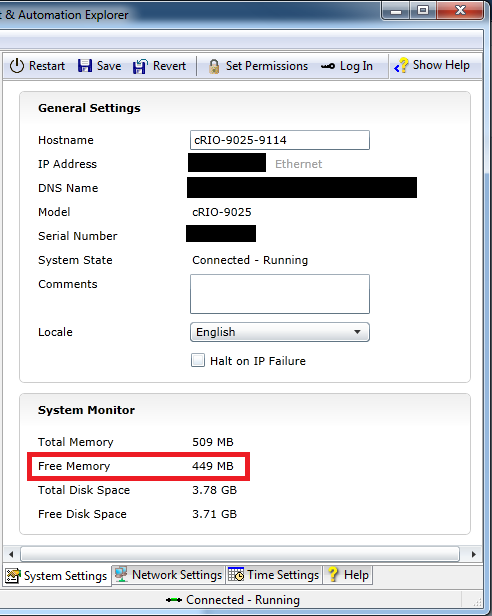
- In the main window, select the System Settings tab. This tab includes the total and available memory, as well as the total disk space and the amount of free space on the disk.
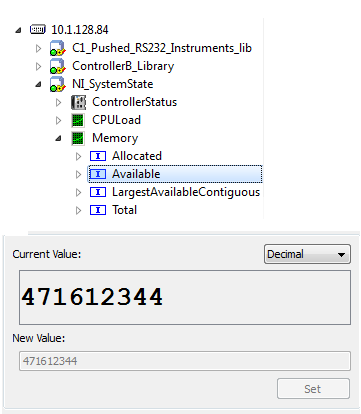
 Externally with the NI Distributed System Manager (DSM) (LabVIEW 2009 or later):
- Open Distributed System Manager. You can do this from Windows by selecting Start»Programs»National Instruments»Distributed System Manager, or from LabVIEW clicking Tools»Distributed System Manager.
- Expand Network Items in the Configuration window.
- Select your real-time controller's IP Address.
- Select the CPU/Memory tab and view the memory usage in the Auto View.
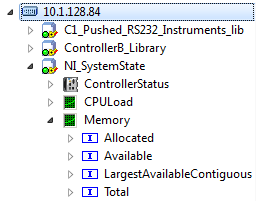
You can also select the individual Shared Variable that holds the Free Memory value to view the available memory.
Note: if you cannot see this information in the NI Distributed System Manager, refer to CPU and Memory Usage Not Visible in NI Distributed System Manager and ensure the System State Publisher is installed in your Real-Time controller.
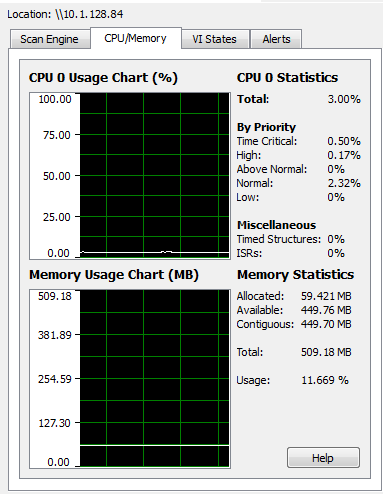
Externally with the Real-Time Trace Viewer:
Another option to monitor CPU usage on RT targets is to use the Real-Time Trace Viewer. With the Real-Time Trace Viewer, you can create execution traces that allow you view memory allocation, CPU usage, and thread scheduling. The Real-Time Trace Viewer is included in LabVIEW 2014 Real-Time Module and later releases. Releases of the LabVIEW Real-Time Module prior to 2014 packaged the Real-Time Trace Viewer as a separate toolkit (the Real-Time Execution Trace Toolkit). Refer to Debugging Multicore Applications with the Real-Time Trace Viewer for more information on using the Real-Time Trace Viewer.
LabVIEW versions 8.6 and Previous:
LabVIEW 7.1, 8.0, 8.2.x, 8.5.x, 8.6.x:
The Real-Time System Manager displays details about VIs running on an RT target and provides a dynamic display of the performance of the target. This will provide the most detailed view of memory usage.
LabVIEW 7.0:
Select Operate»RT Engine Info to view the memory usage information of the RT Engine. You will see both the Total Memory and the Free Memory.
LabVIEW 6.0.2, 6.1:
Add the following line to the labview.ini file on your host computer and restart LabVIEW:
targetmeminfo=true
You can then select Operate»RT Engine Info to view the memory usage of the RT Engine.
Additional Information
- The amount of memory available on a LabVIEW Real-Time controller depends on several factors, including the installed software and user application memory requirements.
- For Linux Real-Time controllers, memory management and reporting differs from other Real-Time targets. Refer to the Memory Reporting Issue with NI Linux Real Time OS Target for information on how to implement memory monitoring.
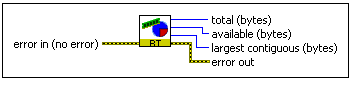
- If you work with LabVIEW 2009 and later, you can monitor CPU and memory usage programmatically using the RT Get CPU Loads and RT Get Memory Usage VIs. Note, these VI's must be run on the Real-Time target.
- If you are using LabVIEW 8.6 or previous, instead of the NI Distributed System Manager, you will need to use the Real-Time System Manager.