The easiest way to do this is to plot an array of data, rather than a waveform, and then scale the X-axis by the inverse of your sample rate.
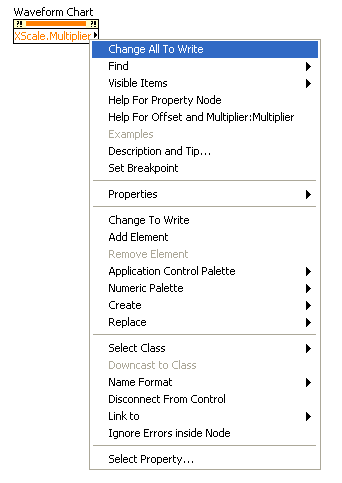
1. In order to access this property, right-click the graph on the Front Panel and select
Create Property Node»X-Scale»Offset and Multiplier»Multiplier. These steps are also shown in the image below:

2. Right-click
the newly created
Property Node and select
Change All to Write. 
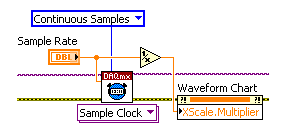
- Use the inverse of the Sample Rate input from the DAQmx Timing VI to set this property. This is shown in the image below:

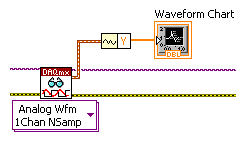
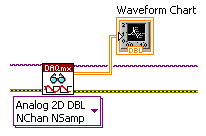
- Ensure data is being passed to the waveform chart as an array instead of as a waveform. There are two options for this:
- Option 1: Use the DAQmx Read Waveform VI combined with the Get Waveform Components VI to plot only the y values.

- Option 2: Use the DAQmx Read 1D or 2D array and plot the resulting array.

The graph or chart will now display data starting at 0 seconds. If N number of samples are read at a rate of X then the graph or chart will display data between 0 and N*X seconds. See the attached VI to see an example of how to implement these changes.