Nyquist Theorem Exercise
- Download and install the NI LabVIEW SignalExpress evaluation software if you do not already have it installed on your computer.
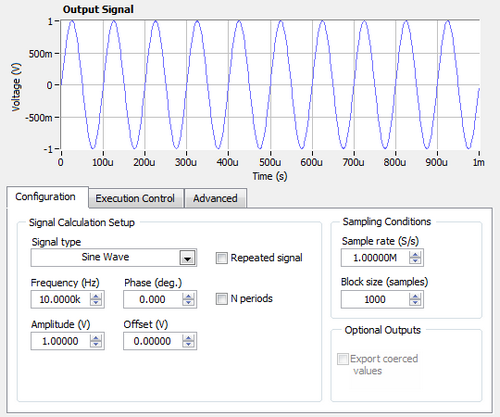
- Create an analog signal by selecting Add Step»Create Signals»Create Analog Signal.
- Under Signal Calculation Setup, specify the signal frequency to be 10 kHz and starting sampling rate at 1MHz – 100 times greater then the signal frequency.
 Figure 1.
 Create an Analog Signal in NI LabVIEW SignalExpress.
- Click on the Data View tab. Drag and drop your sine wave from the Project View into the Data View.
- Create 10 KHz signal sampled at 50 KHz – 5 times the signal frequency, by repeating steps 2 and 3.
- Graph the new sine wave by choosing Add Display in the Data View. Drag and drop the new sine wave from the Project View into the Data View. Zoom in on the display by clicking on the magnifying glass in the graph palette.
- Create another analog 10 KHz signal, which will be sampled at rate 20 KHz - two times larger then the signal frequency by following steps 2 and 3.
- Repeat step 6 to add a display and zoom in on it.
 Figure 2.
 Sampling at rates below one-half of signal frequency results in aliased signals.
- Note that at lower sampling rates we still get the proper frequency of the signal, but the shape is distorted.
- Sampling a signal at the same rate as the signal frequency will produce a straight DC signal. NI LabVIEW SignalExpress takes into consideration the Nyquist theorem and will not allow you to sample at frequencies lower than twice the signal frequency.
Quantization Error Exercise
- Create a new SignalExpress project by choosing File»New.
- Create an analog signal by selecting Add Step»Create Signals»Create Analog Signal.
- Under Signal Calculation Setup, specify the signal frequency to be 1 kHz and sampling rate to be 100kHz.
- Select Add Step»Processing»Analog Signals»Convert Analog to Digital.
- In the Configuration tab, change the resolution to 3 bits.
 Figure 3.
 Use LabVIEW SignalExpress to convert an analog signal to digital.
- In order to see how accurately you have represented the original sine curve, convert this 3-bit digitized signal back to analog. Do this by selecting Add Step»Processing»Digital Signals»Convert Digital to Analog.
- Click on the Data View tab. Drag and drop the sine wave created in steps 2 and 3 into the Data View.
- In the Data View, select Add Display»Time Graph. Drag and drop the analog waveform created in steps 4 and 5 into the new time graph. Note the difference between the two analog signals due to the low resolution of the digitized signal.
- Repeat steps 4 and 5, but digitize the original signal with a 5 bit resolution. Ensure that the original sine wave is chosen on the Input tab of the Convert Analog to Digital step.
- Repeat step 6 to convert the new digital signal back to analog.
- In the Data View, select Add Display»Time Graph. Drag and drop the newly created analog signal created in step 10 into the new time graph. Note that the 5 bit analog waveform more close resembles the original signal than the 3 bit analog waveform.

Figure 4. Low-resolution measurements increase quantization error.
Challenge
Analyze the optimal bit resolution for various curves at different frequencies and sampling rates.