In addition to the built-in performance monitoring already offered by our product offering, there are also Windows system tools available to monitor almost all types of performance, including CPU, memory, file system, and network usage. You don't just have to trust the Task Manager.
There is a Windows utility called PerfMon (Performance Monitor) that has the ability to graph and record performance metrics for specific processes, as well as configure alarms and times for performance monitoring and recording.
Steps to view and record performance data with Windows 7 Performance Monitor:
- Make sure LabVIEW is open.
- Click the Start menu and click Run ....
- Type perfmon at the Run command prompt and click Ok .
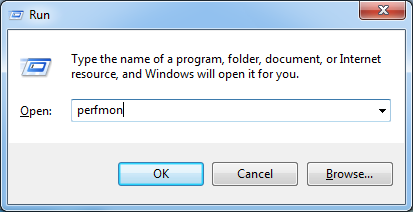
- You will then see the Performance Monitor pop-up.
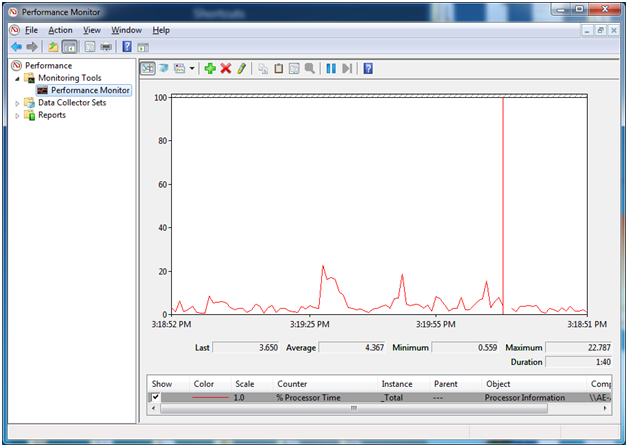
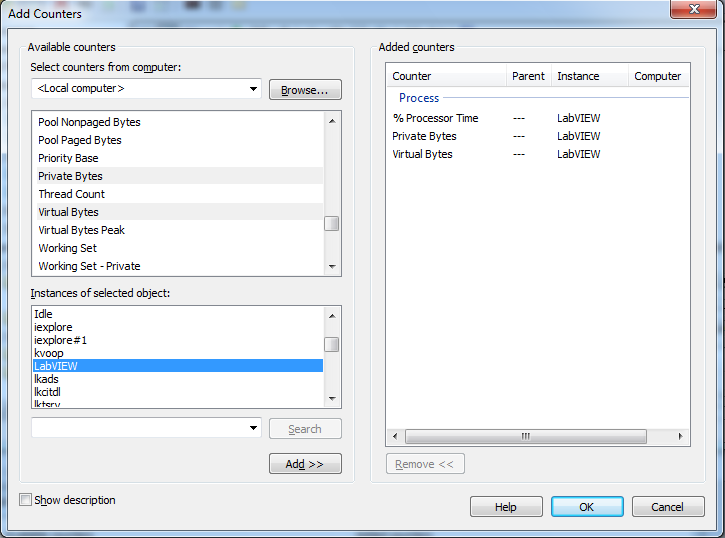
- Click the green '+' sign near the top of the Performance Monitor window to bring up the Add Counters window.
- On the left, choose which counters to add and click Add >> . Your counters should now appear under Added Counters. Click OK .
There are many options in Counters to Add. Some of the ones that may be of particular importance when it comes to LabVIEW performance problems are:
- Memory
- Processor
- Process (shown above): During the process, one can choose specific programs to monitor. In the upper left window, you can select the aspects of the process that you want to monitor, such as % Processor Time or Virtual Bytes . In the lower left window, you can select which process you want to monitor. Above, LabVIEW has been selected.
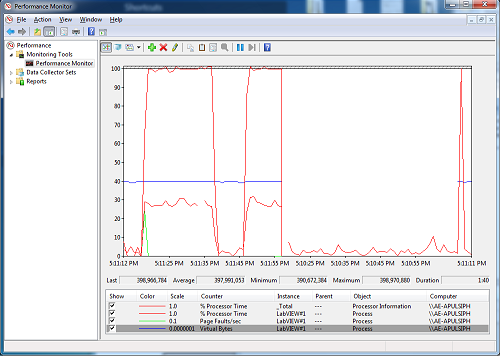
- You should now be able to see the update of all the chosen counters on the chart.
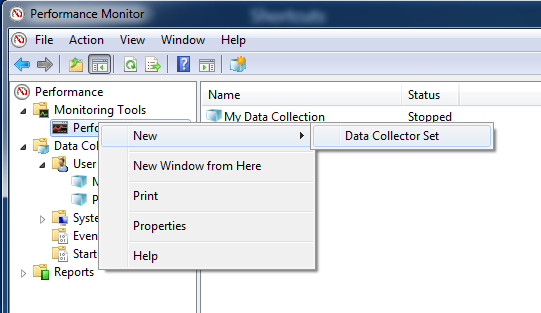
- To record this data to a file, right-click on the Performance Monitor and select New »Data Collector Set .
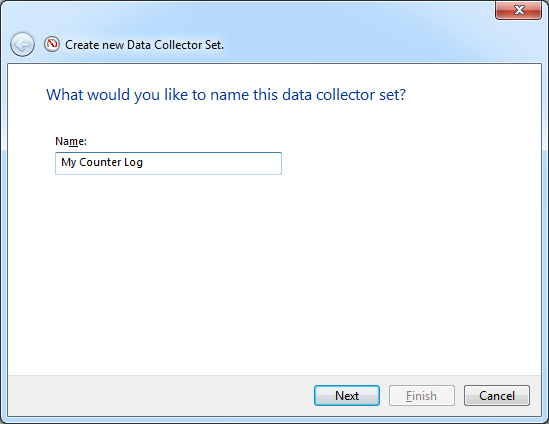
- Enter a name for your dataset and press Next .
- Complete the rest of the steps, including choosing the location where you want to save your log file.
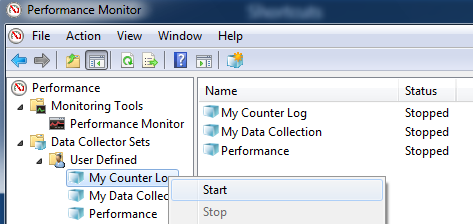
- When you want to start logging performance data, right-click on your set of data collectors and select Start . To stop the recording, right-click and select Stop .
Note: PerfMon provides ActiveX properties and methods, allowing you to control it through another ADE and even use it as a built-in control in an application.