Performance Monitor (PerfMon) is a Windows monitoring tool that can graph and log performance metrics for specific processes. Use this tool coupled with unique test cases to isolate components in your system that are causing memory growth. Unlike Task Manager, Performance Monitor measures memory usage at regular intervals, which is useful if the test system must run for a long period of time before memory growth is apparent.
This tutorial shows you how to use Performance Monitor to measure the memory usage of a TestStand process, display this information on a graph, and save the data to a log file.
- Launch Performance Monitor from the Start Menu.
- To view a graph of memory usage, click on Performance Monitor in the configuration tree.
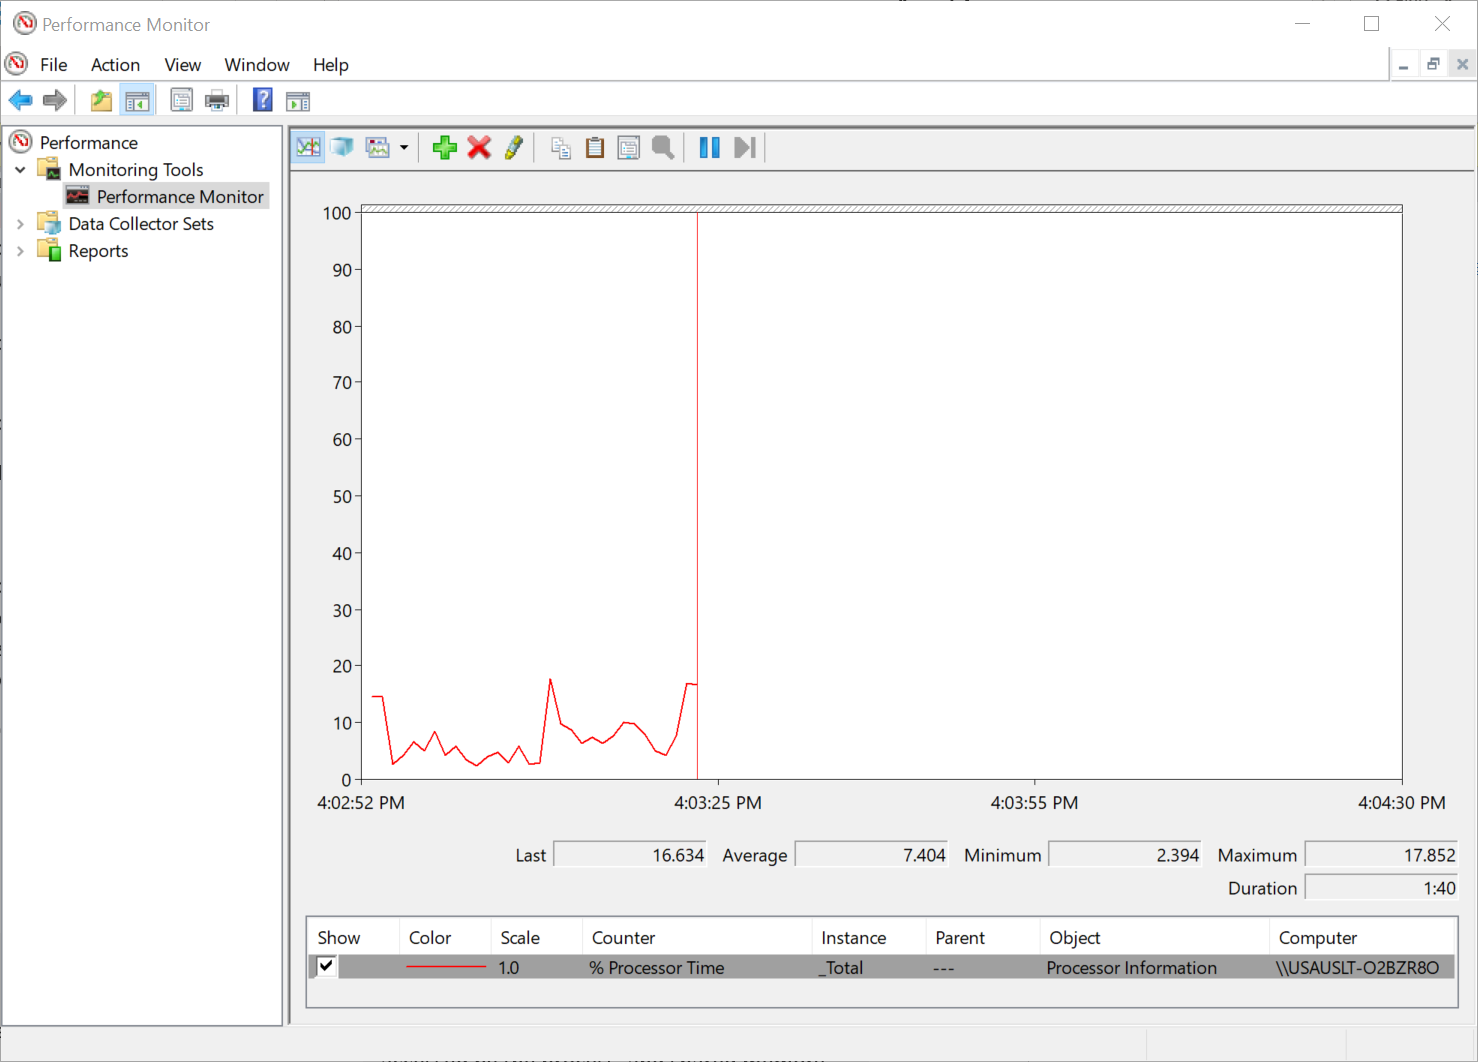
Performance Monitor displays information by graphing the values of counters. Counters represent various aspects of memory usage and system performance. You can configure the set of counters displayed on the Performance Monitor graph.
- Select any existing counters in the table at the bottom of the Performance Monitor window.
- Press the Delete key on the keyboard to remove these counters from the graph display.
- Right-click on the graph area. Click Add Counters…
The
Add Counters dialog box appears. There is a scrollable list box with all the counters available to you, categorized by group.
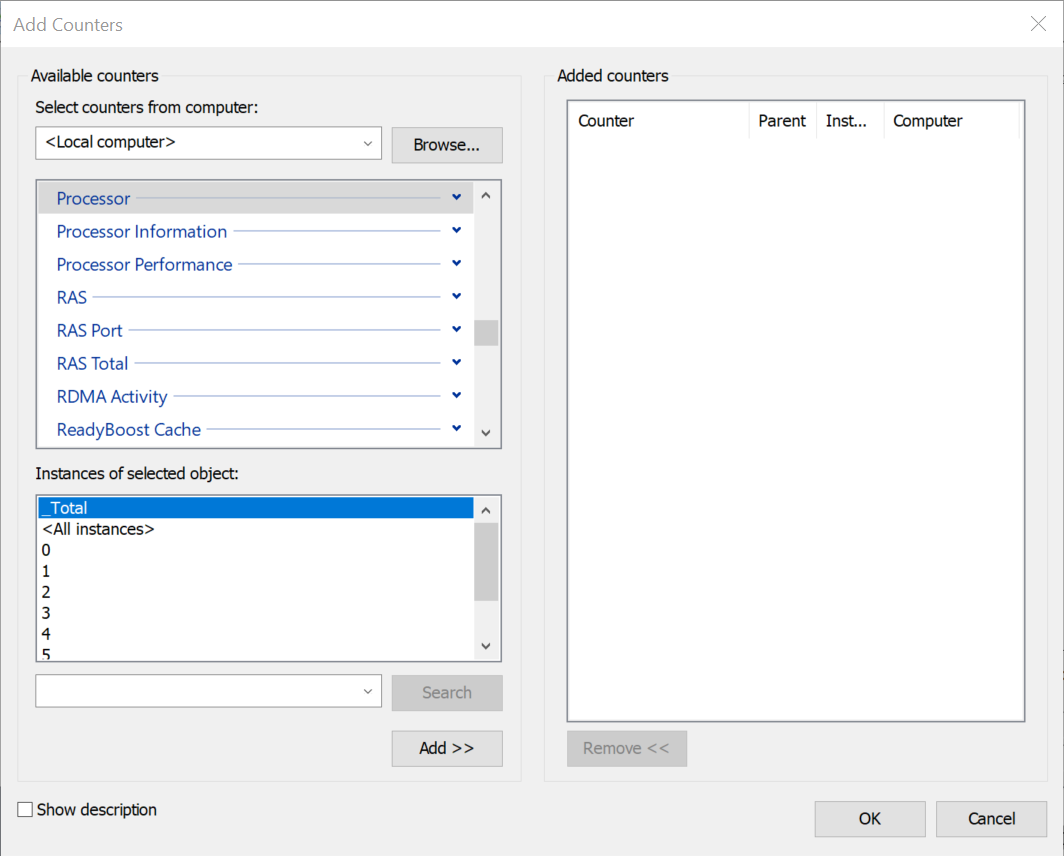
6. Locate the group you are interested in, expand it, and select a counter.
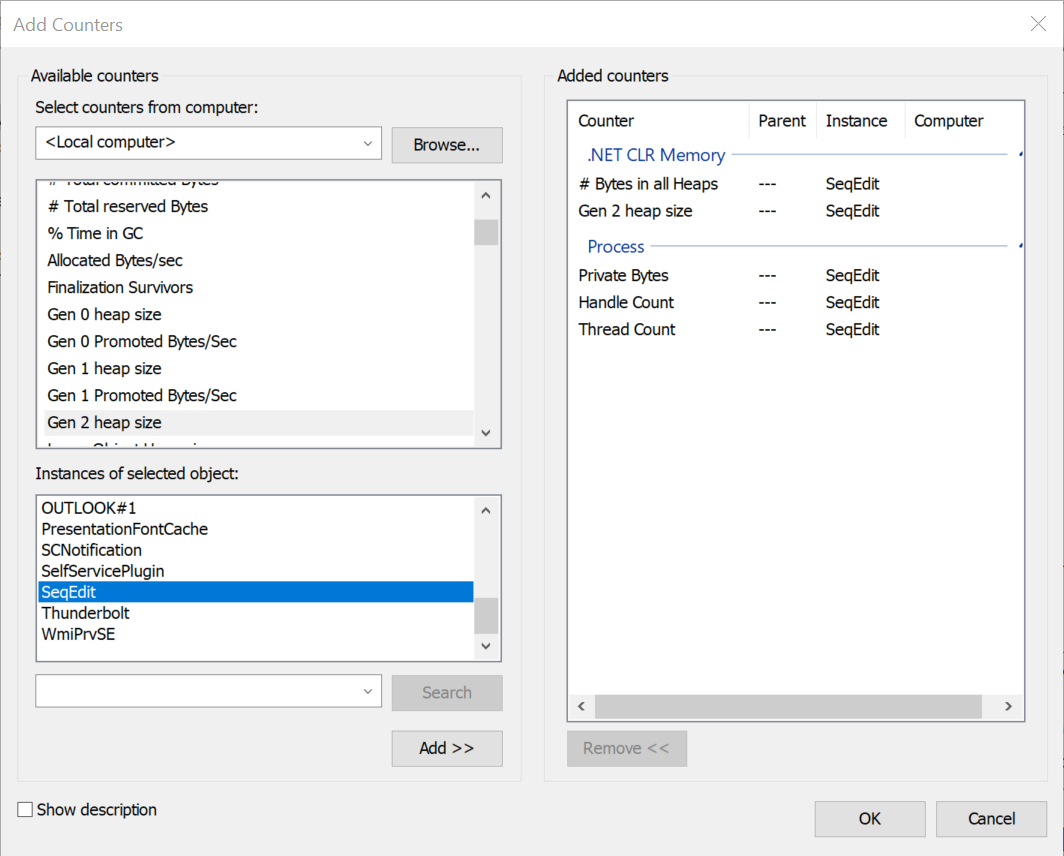
For memory growth issues, it is often useful to enable the
Private Bytes, Handle Count, Thread Count, #Bytes in all Heaps, and
Gen2 Heap size counters. All these metrics are a snapshot of the resources currently used by the application. The following table explains the meaning of each counter.
Note: For any other counters not included in the table, enable
Show Description to view the description of the counter.
| Group | Counter | Description |
|---|
| Process | Private Bytes | The amount of private memory in use by the process. A process’ virtual memory space consists of private memory, which can only be accessed by the process, and shared memory, which can be accessed by other processes. |
| Process | Handle Count | The number of object handles in the process’s object table. Maintaining references to instrument driver sessions, loading LabVIEW VIs, and many other operations can cause the number of handles to increase. |
| Process | Thread Count | The number of threads running in the process. |
| .NET CLR memory | # Bytes in all Heaps | The total amount of memory being used by the process to store .NET objects. |
| .NET CLR Memory | Gen 2 heap size | The amount of memory being used by the process to store .NET objects on the Gen 2 heap. The Gen 2 heap is an area of .NET memory where objects which have been in memory for a long period of time are stored. This value may indicate that .NET objects are not being released when they are no longer needed. |
- Select the process of interest in the Instances of selected object list.
For TestStand systems, this is typically
SeqEdit or the name of your user interface executable, depending on whether you are executing your test system in the TestStand Sequence Editor or a user interface.
For LabVIEW applications, select
LabVIEW.
- Click the Add button to add the counter to the Added counters list.
- Repeat steps 6-8 until you have all your desired counters in the Added counters list.
- Click OK on the Add Counters dialog. The Performance Monitor graph begins to update with the values of the newly added counters.
Configure Performance Monitor Graph
You will likely need to adjust the settings of the graph to ensure that all counter values are scaled properly for the graph display and to ensure that the graph displays data from a long enough period of time for you to determine whether memory usage is growing as the system executes.
- Press Ctrl+Shift+A to select all counters displayed in the table at the bottom of the window.
- Right-click and select Scale Selected Counters. This will scale the values of each counter so that the counters are visible in the graph window.
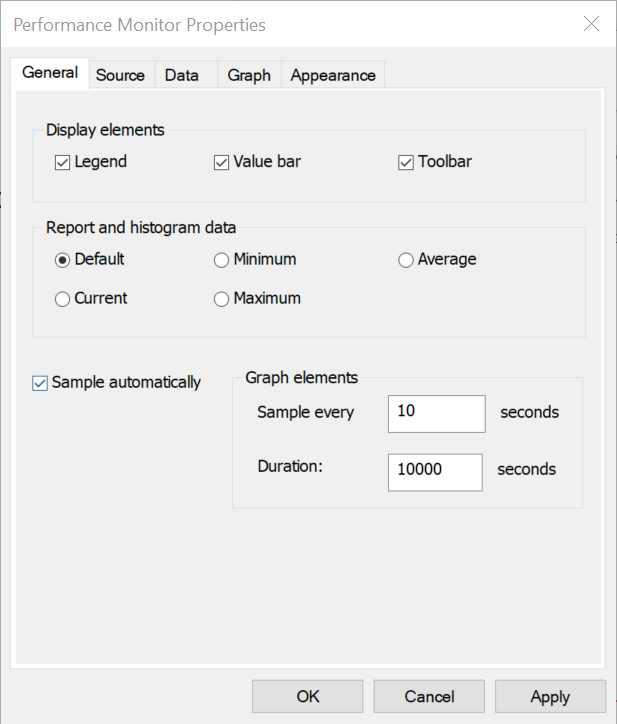
- Right-click on the graph and select Properties… The Performance Monitor Properties dialog box appears.
- On the General tab, set the Sample every value and Duration value so the graph will display memory growth over a long period of time.
For example, you can set the
Sample every value to 10 and the
Duration value to 10000 to graph a new value every 10 seconds and display a total of approximately 2.5 hours of information in the graph window.
- Click OK.
- Right-click on the graph area and select Clear. This removes any existing graph data before you run a test case.
- Execute a test case. Examine the Performance Monitor graph to determine whether any of the counter values are growing as the test system executes.
Log Memory Data to File
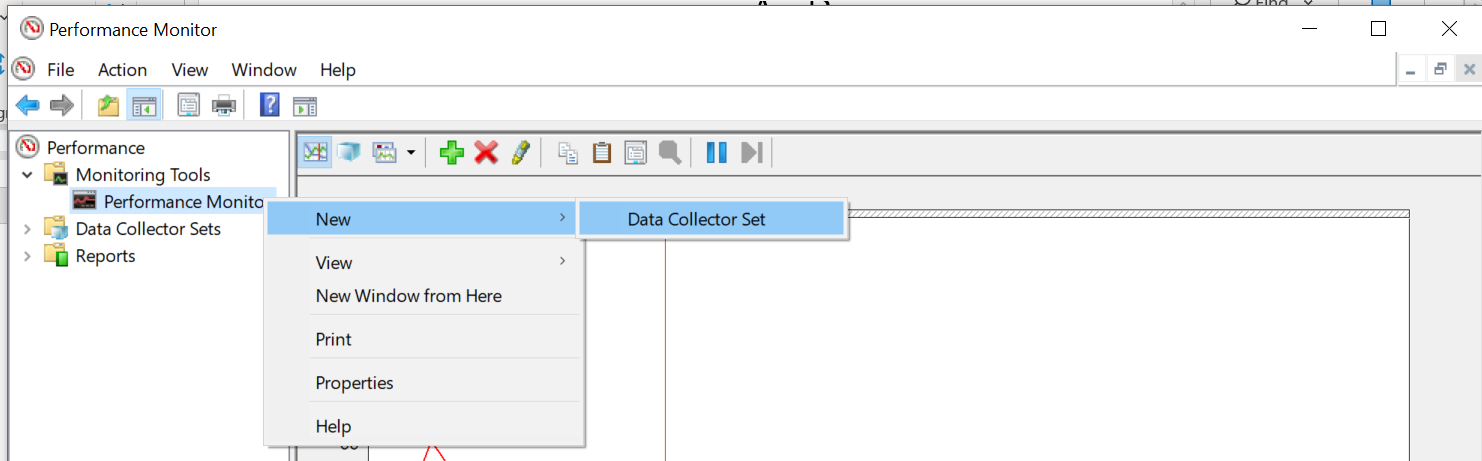
- Right-click on Performance Monitor from the configuration tree. Select New»Data Collector Set.
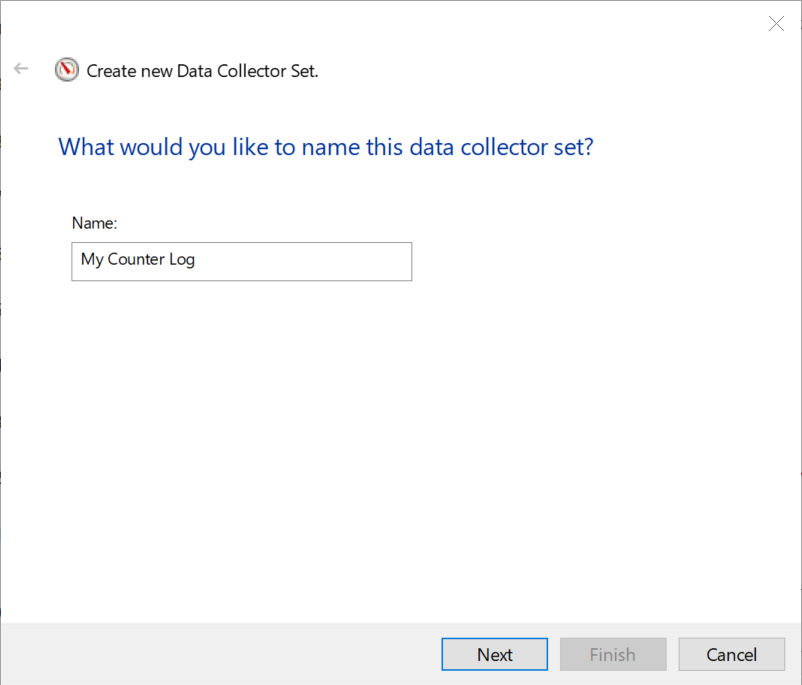
- Enter a name for your data set. Press Next.
- Choose the location where you want to save your log file. Click Next.
- Select Save and Close. Click Finish.
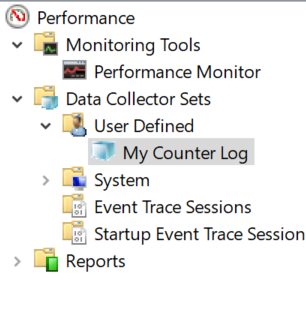
The new Data Collector Set appears in the Configuration tree under
Data Collector Sets >> User Defined.
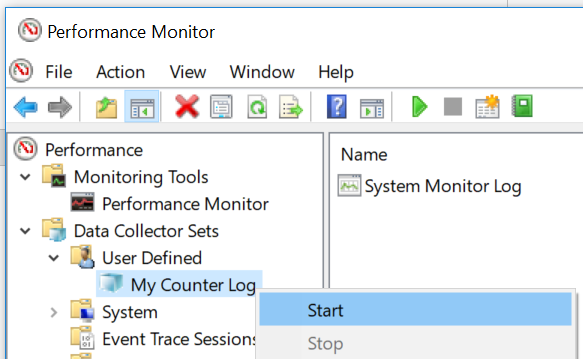
When you want to start logging the performance data, right-click on your Data Collector Set and select
Start. To stop logging, right-click and select
Stop.
Example
This is an example of what the Performance Monitor graph might look like after running a test case:
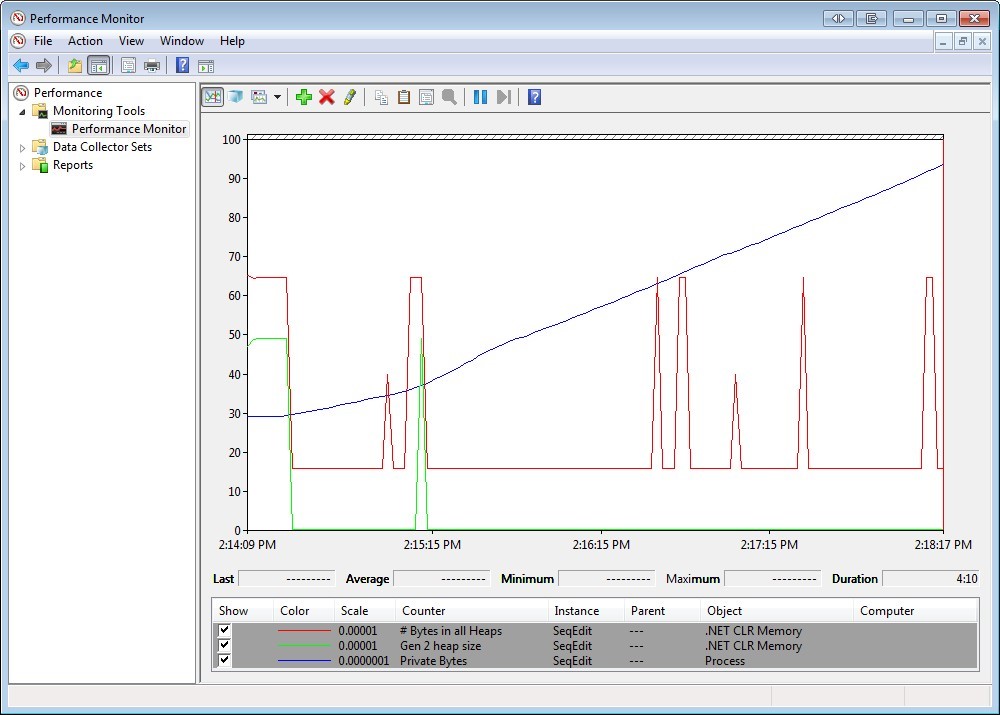
The
Private Bytes counter (blue line) grows at a constant rate, while the
# Bytes in all Heaps and
Gen 2 heap size counters do not. This indicates that the memory space of the Sequence Editor process is growing over time, which indicates that a memory leak could occur. Since the
# Bytes in all Heaps and
Gen 2 heap size counters are not growing over time, the memory growth does not appear to be caused by .NET memory. If these counters were growing, this would indicate that the process is continuing to open .NET references and not closing the references that are no longer needed.
For more information about the significance of Gen 2 heap size and .NET garbage collection, please refer to
External: Fundamentals of Garbage Collection.