NI recognizes that it is important to consider opportunities for code reuse whenever moving forward with a new project or platform. The Call Library Function Node is a LabVIEW VI which allows for code reuse that calls a DLL or shared library function directly inside your LabVIEW code. NI Linux Real-Time installs the GNU debug server on NI embedded hardware so that you can debug C and C++ shared libraries called by your LabVIEW Real-Time application.
Compiling your shared library
Refer to Creating Shared Library For LabVIEW Real-Time or VeriStand on NI Linux RT Target.
Programming in LabVIEW Real-Time
- Make sure the LabVIEW Real-Time Module is installed.
- To create a blank LabVIEW project, open LabVIEW and select File»Create Project…»Blank Project»Finish.
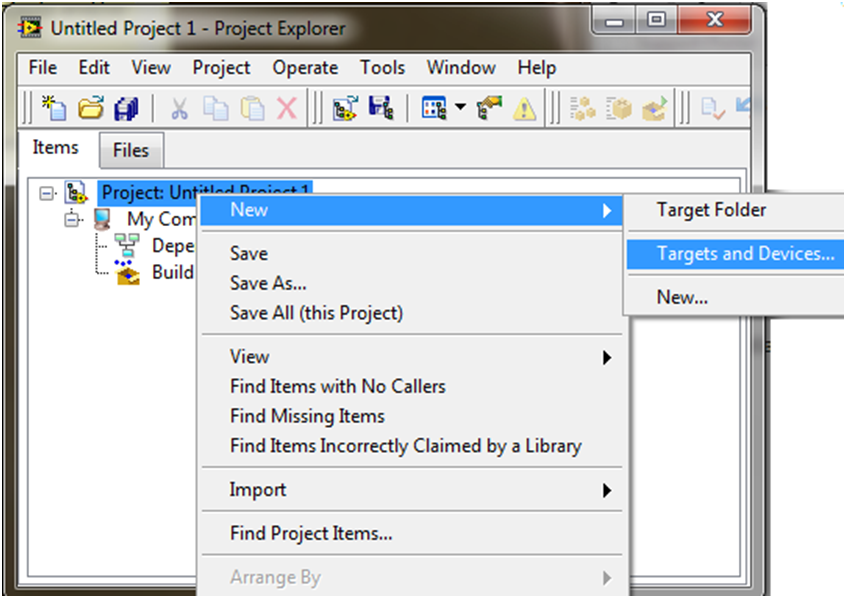
- Add a real-time device to the project by right-clicking on Project: <Project Name> and selecting New»Targets and Devices.
- If your embedded system is connected and running, select Existing target or device and find the device in the expandable list for your target type (example: Real-Time CompactRIO). Otherwise, select New target or device and expand the appropriate list to select your embedded system type (example: cRIO-9068).
- To create a VI that will run on your real-time target, right-click on the Real-Time Target in the project and select New»VI. For more detailed information about setting up a real-time project and general programming practices for real-time, check out this developer’s guide.
- Before the C shared library can be accessed from LabVIEW on the NI Linux real-time target, the .so shared library will have to be present on the device. Place the file within the /usr/local/lib directory on the real-time target so that it will be automatically loaded into memory upon startup. Refer to Tools Available for File Transfer/Access on NI Linux Real-Time Targets to transfer files to your real-time target. Alternatively, this can be done securely within the Eclipse environment as follows:
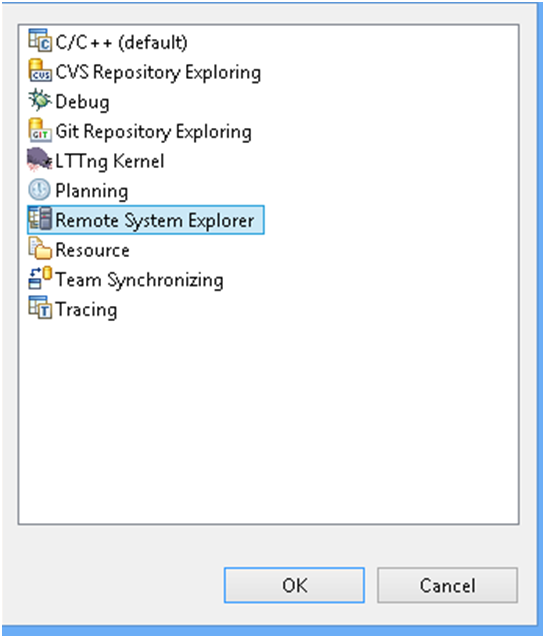
- Within Eclipse, select Window»Open Perspective»Other… and select Remote System Explorer.
- On the Remote Systems tab, select New»Connection and choose SSH Only.
- Type in the IP address of your real-time target for Host name and Connection name, click Finish.
- Expand Sftp Files and a popup will appear to request a User ID and Password. By default, the user id will be admin and the password will be blank.
- Once you have logged in, expand the files under your embedded system to find /usr/local/lib. Now, expand the files under your local computer to find your .so file. Drag it from the host computer to /usr/local/lib to transfer it to the embedded system.
- Restart the real-time target by pressing the reset button on the device or clicking Restart in NI Measurement and Automation Explorer (MAX) to load a shared object file.
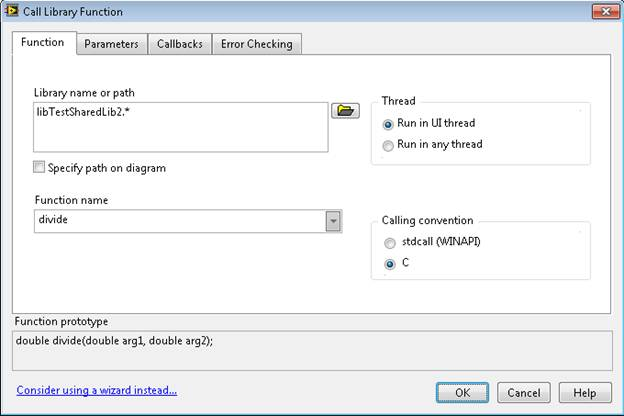
- Right-click on the block diagram to bring up the Functions palette and select the Call Library Function Node from Connectivity » Libraries & Executables. Double-click on the node to bring up the Call Library Function dialog box.
- Type the name of your library in Library name or path box with an asterisk as the file extension. Depending on what operating system the code is running on, LabVIEW will replace the asterisk with the appropriate extension. Note that if you are developing within the Windows environment, LabVIEW will be unable to populate the Function name drop down based on a .so file. You will need to manually type in the Function name that you want to call.
Optionally, you can build your code into a
.dll file as well. This DLL will have no functionality on the Linux real-time target, but pointing to this file during development will allow the Function name dialog box to populate. Also, on the development computer, the
.dll file (along with a
.h file) gives you the option to use the Import Shared Library Wizard to automatically create VI wrappers for your code as described in
Call a Dynamic Link Library (DLL) from LabVIEW. However, you would have to go back into the wrappers and remove the dll extension from the file and replace with an asterisk as shown in the picture above.
- Configure the Parameters, Callbacks, and Error Checking tabs as you would on any operating system as described in An Overview of Accessing DLLs or Shared Libraries from LabVIEW. Note that configuring these options requires a solid understanding or documentation of the functions being called.
- You can now press the Run arrow at the top of the block diagram to deploy and run the code on your device. For deployment, we recommend that you build your code into an executable as described in Building and Deploying a Stand-Alone Real-Time Application (Real-Time Module) .
Debugging
The GDB debug server allows developers to debug shared library code called by a LabVIEW VI. This can be done within the Eclipse environment or using the command line and an SSH Client. Both options will be discussed here.
For some debugging steps, GDB must have access to the .so files and other information from target directories. Therefore, before you start debugging, the /usr and /usr/lib directory (or the directory contains your .so files) must be copied over to the host computer. See Step 6 under Programming in LabVIEW Real-Time above for information about how to transfer files between the host and the embedded system in Eclipse. For the rest of this document, the folder on the host you have copied these files into will be referred to as <RootFileSystemDir>.
Debugging within Eclipse
Refer to Getting Started with C/C++ Development Tools for NI Linux Real-Time, Eclipse Edition for basic information on using the Eclipse environment to communicate with your NI Linux Real-Time embedded system as well as information on general debugging within Eclipse.
- Ensure that you have configured your remote system in Eclipse so that it appears and is accessible from the Remote System Explorer perspective.
- Under the Project Explorer, right-click on your project and select Properties. In the left-hand menu, select C/C++ Build. Within the Builder Settings tab, change the Builder type to Internal builder.
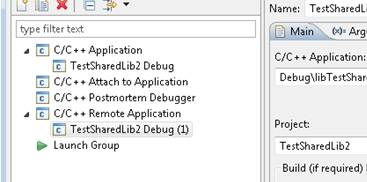
- Select Run » Debug Configurations to bring up the Debug Configurations dialog box and select your debug configuration under C/C++ Remote Application. If it is not there, double-click on C/C++ Remote Application to create one.
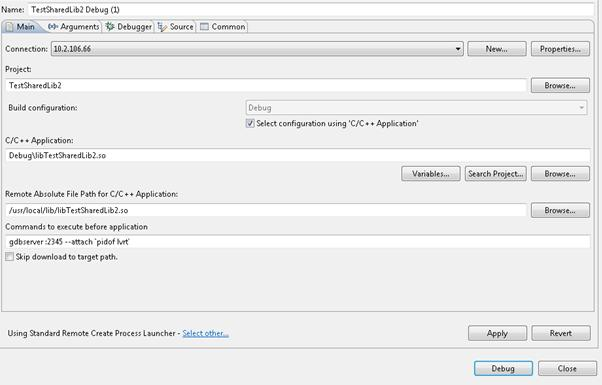
- Make the following changes on the Main tab.
- At the bottom of the menu, make sure that it reads Standard Remote Create Process Launcher. If not, click Select other… and select Standard Remote Create Process Launcher.
- Change Connection to point to your embedded system.
- Change the Remote Absolute File Path for C/C++ Application to the Linux-style path that points to your shared library (.so file) on your embedded system.
-
Add the following command to Commands to execute before application:
gdbserver: NNNN –attach $(pidof lvrt)
(where NNNN is an available TCP port on the embedded system)
- Switch over the Debugger tab and change the following settings in the Main tab.
- Browse to the correct path for the GDB debugger executable
- (ARM-based targets)
<Eclipse>\14.0\arm\sysroots\i686-nilrtsdk-mingw32\usr\bin\armv7a-vfp-neon-nilrt-linux-gnueabi\arm-nilrt-linux-gnueabi-gdb.exe - (Intel x64-based targets)
<Eclipse>\14.0\x64\sysroots\i686-nilrtsdk-mingw32\usr\bin\x86_64-nilrt-linux\x86_64-nilrt-linux-gdb.exe
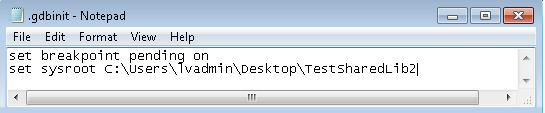
- Browse to the path of the .gdbinit file in your project. If it does not exist, create a text file within your project directory and save it as .gdbinit. The contents of the file should be:
set breakpoint pending on
set sysroot <RootFileSystemDir>
- Uncheck Stop on startup at: main
- Switch to the Gdbserver Settings tab and ensure that the Port number matches the number (NNNN) chosen in step 4.
- Click Apply and then Debug.
- You will get a warning asking if you want to open the Debug perspective. Click Yes.
- In the bottom, right-hand corner of Eclipse, press Display Selected Console and choose the option with the gdb.exe extension. Click Pin Console preserve this console view.
- Place breakpoints as desired in your source code.
- Now when LabVIEW calls the code containing the breakpoints, execution will be suspended and LabVIEW on the host will disconnect from the real-time target.
- When execution is suspended, you should be able to type commands into the gdb console or debug using the buttons in the Eclipse environment (Step Over, set breakpoints, etc.). To discover what commands are available, type “help”.
Debugging using the Command Line and an SSH Client:
- Open the command line on the local host and navigate to the location of the GDB debugger on your computer.
- (ARM-based targets)
<Eclipse>\14.0\arm\sysroots\i686-nilrtsdk-mingw32\usr\bin\armv7a-vfp-neon-nilrt-linux-gnueabi - (Intel x64-based targets)
<Eclipse>\14.0\x64\sysroots\i686-nilrtsdk-mingw32\usr\bin\x86_64-nilrt-linux\
- Execute the GDB debugger by typing the name of your debugger.
- (ARM-based targets)
arm-nilrt-linux-gnueabi-gdb.exe - (Intel x64-based targets)
x86_64-nilrt-linux-gdb.exe
- Enter the following commands:
Set breakpoint pending on
File C:/<path to the sharedObject from Eclipse Project>/<libEXAMPLE.so>
Set sysroot <RootFileSystemDir>
- Add breakpoints to your code by typing “b” and then the line number where you would like the breakpoint. (If you don’t add breakpoints, the GDB debugger will not have a reason to suspend execution so that you can debug).
- Open an SSH Client (such as PuTTY) and type in the following shell command: gdbserver:NNNN –attach ‘pidof lvrt’ (where NNNN is an available TCP port on the embedded system)
- Move back to the command line window and type the following command: Target remote <Target Name>:NNNN (Make sure that NNNN matches the TCP port defined in step 5)
- Run the code that calls the shared library. Execution will suspend, LabVIEW on the host will disconnect from the real-time target, and you should have control of the debugger. Once you have control, you can type commands into the console to set breakpoints, step through the code, etc. Type help to learn more about the debug options.
- When you are finished debugging, make sure the the GDB debugger is not in continue mode and type detach. The gdbserver process running on the embedded system will terminate and allow the lvrt process on the real-time target to continue running.