1. Creating MacBeth ColorChecker Chart Reference Image
Create a reference image of the MacBeth ColorChecker chart by using the NI Vision Development Module and the color hex values from the Wikipedia article, ColorChecker. The reference image should match the one below.
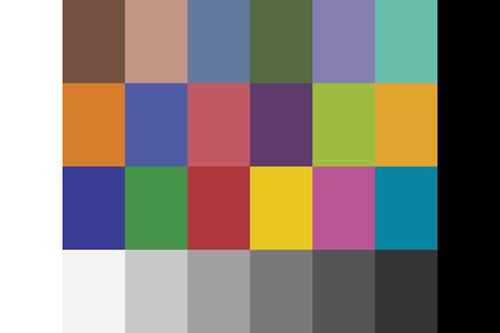
Figure 1. MacBeth ColorChecker Chart Reference Image
The white bar preceding the MacBeth ColorChecker Chart will be difficult to see but is contained within the image.
Configure the reference image this way so a 100% Color Bar measurement can be performed and then use the measured color differences as the expected values. More information on the 100% Color Bar measurement is available in the NI VMS Help»Video Measurements section. This measurement expects to see the following image below.
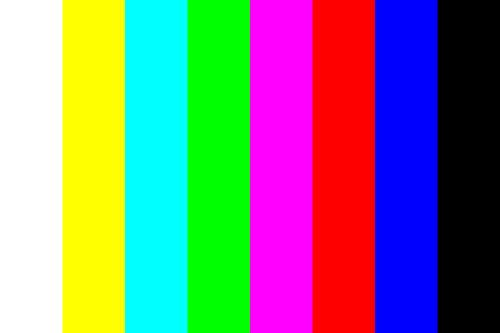
Figure 2. 100% Color Bar
2. Configuring NI Video Measurement Suite
Open the MacBeth ColorChecker image created in the above steps in VMS. The following pop-up window will appear. Set the video standard to a predefined standard 720x480p 60 for this tutorial. Press the OK button.
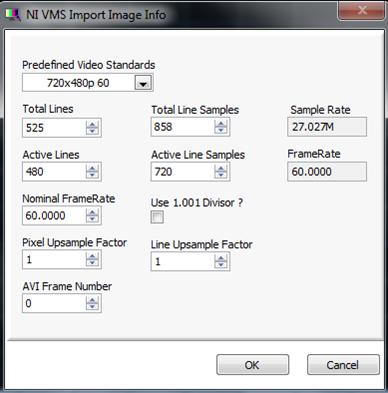
Figure 3. NI VMS Import Page Info
3. Taking a Measurement in NI Video Measurement Suite
Complete the following steps to set up a measurement in VMS:
Click on the Picture tab in VMS and the image will display. This confirms that the image loaded correctly.
Click on the Analysis tab on the left pane. Open the following locations file: 480p OmniGen.loc. This is one of the default locations files installed with VMS. We are going to modify it for our ColorChecker.
Click on the drop-down box below Measurement Group: Standard (by default, it should say H-Timing). Set this to Colour Bars.
Drag the cross-hair over the image so that it cuts through the grayscale gradient along the bottom section of the image. The result should match the below image.
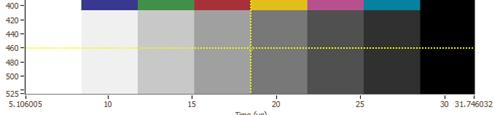
Figure 4. Cross-Hair Location
Click on View Line to select the line, then click Edit Locations. The NI VMS Measurement Locations Editor will display. Choosing the proper staircase pattern of the signal line will assist in setting up the Measurement Locations.
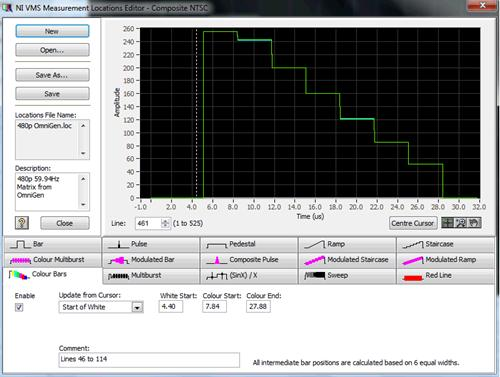
Figure 5. Pattern Location Editor
For the Colour Bar settings, you may want to change the comment to "MacBeth ColorChecker." Also, note the comment at the bottom--all intermediate bar positions are calculated on the assumption of there being six bars of equal width.
The three parameters to set for this measurement location are Start of White, Start of Color, and End of Color. Drag the white, dashed, vertical line cursor to set these locations. For Start of White, drag the cursor to the first vertical rising edge as shown: (The initial flat-line is unseen black information. This is visible at the main NI VMS screen by selecting Total Frame vs. Active Frame on the Picture tab.)
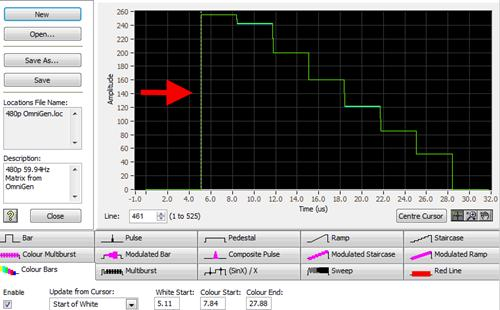
Figure 6. Start of White Cursor Location
Next, change the Update From Cursor drop-down menu to Start of Colour and move the white, dashed, vertical line cursor to the next falling edge towards the right.
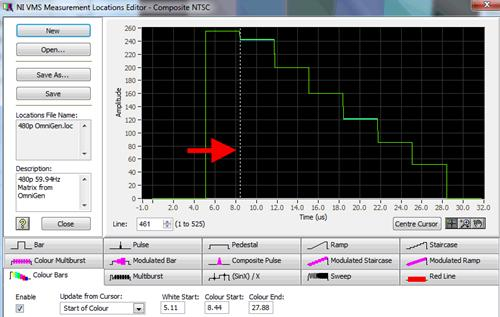
Figure 7. Start of Color Cursor Location
Next, change the Update From Cursor drop-down menu to End of Colour and move the white, dashed, vertical line cursor to the last falling edge just before the black information.
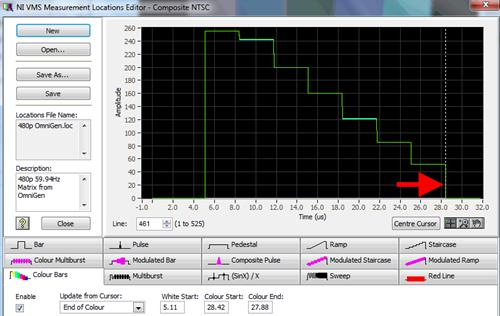
Figure 8. End of Color Cursor Location
It is also possible to make note of the numeric values of White Start/Colour Start/Colour End and enter them manually. Click on Save As and save this locations file with a different name. Close the Measurement Locations Editor.
On the VMS main user interface, pick a line to measure and click the View Line button. Pick a color channel to analyze by selecting the R, G, or B component in the drop-down menu on the left. Then click on Measure Once and observe the results tab. Perform a sample measurement to see if the correct results are generated. In the Figure 9, we have selected line 220 of the active frame and have selected the R component.
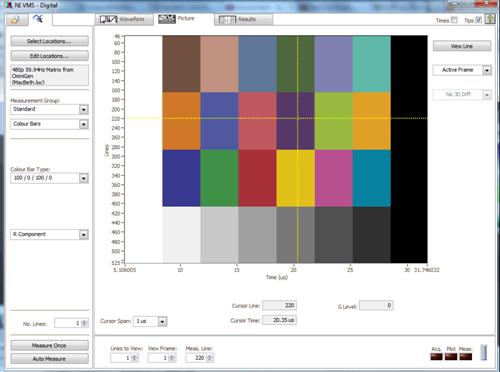
Figure 9. Active Frame Sample Measurement
Click Measure Once to receive the following results.
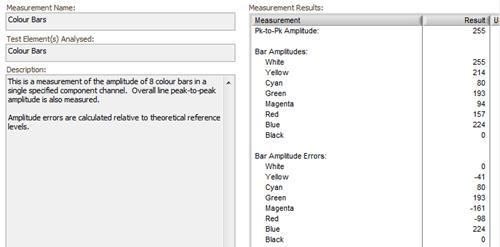
Figure 10. Active Frame Results
For a standard 100% Color Bar test pattern, the red component of each color bar is expressed as an 8-bit number: White: 255, Yellow: 255, Cyan: 0, Green: 0, Magenta: 255, Red: 255, Blue: 0, and Black: 0. The Bar Amplitudes are measured based on their area. Locate the 100% Color Bar image at the beginning for reference.
The color bar in the yellow position has a value of 214 for the red component. The expected measurement is 255 (for the 100% Color Bar test pattern) and because of this the Bar Amplitude Error (the difference between the measured value and the expected value) is -41.
These values become the new standard. When using the standard 100% Color Bar test pattern, the expected amplitude errors should be zero. You must make note of the actual returned values for the MacBeth ColorChecker chart. To obtain all of the necessary reference difference values, the line measurements must be performed on all four unique rows of color sections and for each color channel.
After establishing these standards, you can then set the limits and test conditions for your video test based on the Bar Amplitudes and Bar Amplitude Errors that VMS returns.