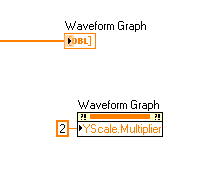
To scale Y coordinates on your graphs you will need to create a property node and use the YScale.Multiplier property.
- Right-click the graph indicator and selecting Create » Property Node » Y Scale » Offset and Multiplier » Multiplier
- Right-click the property node and select Change All to Write.
- Wire a constant or control into the property node to set the value of the multiplier

Repeat steps 1 - 3 to scale the X coordinates of your graph, but in this case use an
X Scale » Offset and Multiplier » Multiplier property node.
Additional Information
You can also apply an offset to the coordinates by using the Y.Scale.Offset property found under the
YScale » Offset and Multiplier » Offset menu path.
If you write to multiple properties in the same node, ensure that the Multiplier and Offset properties are the highest in the node (a property node will execute from the top down). If they are not the first properties modified, they may not update until the next iteration due to internal dependencies.