Types of I/O Compatible with Data Dashboard
The first type of I/O that can be used with Data Dashboard is shared variables. They can both read and write data to the host system. Shared variables interact with the host application through the LabVIEW Shared Variable Engine (SVE) and update in Data Dashboard when they receive updated information from the server. Shared Variables support primitive data types (eg. Numeric Doubles, Booleans and Strings) as well as arrays of those primitive data types.
The second type of I/O that can be used with Data Dashboard is LabVIEW Web Services. Web services are used for the interaction with a collection of primitives and the connection is only made once. There are two different modes that users can employ with web services on Data Dashboard: polling and calling. Polling a web service is designed to display the data from a web service at a constant rate, specified by the user. It is a read-only interaction. Calling a web service is designed for both displaying data as well as pushing data back to the host application. The data is updated when the user pushes a button to execute the call and does not continue to update like polling does. It is a read/write interaction.
Shared Variables in Applications with Data Dashboard
Shared variables interact with the host application through the LabVIEW Shared Variable Engine (SVE) and the updates are handled through the Publish Subscribe Protocol (NI-PSP). For Data Dashboard to have access to these variables, they must be deployed to the SVE through a library project item. Each variable in the library will be deployed and the SVE will reserve a memory space for it. They will remain in the memory space as part of the LabVIEW process whether Data Dashboard is interacting with them or not. With larger data types and data types that can vary in size (strings and arrays) it is important to remember that mobile devices are very different from a full development system. There are limited resources available on these devices. Therefore, with types such as strings and arrays, as they get larger, we can over burden the application causing problems and even crashes. With the continuous update mode of share variables and the ability to push these large sets of data to the device rapidly, it is important to be cognizant of this so that risks of crashes are lessened..
Shared variables are a quick way to integrate Data Dashboard into an application. They are easy to create and add to an existing VI. Shared variables operate over TCP-based network communications. Therefore for them to be compatible with network Firewalls, there must be exceptions made for these ports. It is also important to remember that these ports are now open and there is no way to encrypt the data being sent via shared variables. It is a solution best suited for internal or private networks.
Integrating Polling Web Services into Applications
There are some limitations to using Shared Variables with Data Dashboard. As the amount of data being transferred and the frequency of transfers increases, so does the number of events that must be processed on the mobile device. This increased data processing and handling can cause slow performance and sometimes crashes. Polling a web service can solve this issue. Polling limits data updates to be at regular intervals, resulting in a performance advantage. Getting all of the data at one time also allows for a simpler way to set up the calls. Rather than having to configure each indicator individually, it is done all through one configuration window.
Another important aspect to network communication is security. Implementing a project with web services allows for security to be implemented into remote monitoring and control application. Because web services are based on standard HTTP communication protocols, no Firewall exceptions must be made. More advanced user information can also be tracked and manipulated by using session-based interactions. The LabVIEW web server can cache information about each session and give unique information based on the client. Web services also support security with NIAuth that requires users to have proper credentials to access certain data. Shared variables, however, do not support any kind of authentication. For more information on how to configure secure web services, please see Configuring Web Services Security
Integration a Web Service Call into Applications
Web services provide the best implementation and performance for monitoring and controlling large sets of data, as well as keeping the advantages of a web service (security, SSL, standard communication). When implementing them into an existing application, web service calls can be used to trigger events and processes them within the host application. When you call a web service, you can also send data from Data Dashboard to the host application with the event trigger. This allows for flexible and responsive architectures to be used in the host application.
One architecture that lends itself well to integrating a web service call is a Queued Message Handler. In LabVIEW 2013, web services run in the same application instance (e.g. namespace) as the rest of the LabVIEW application. This allows for use to take advantage of non-network-based protocols (like global variables or named queues) in the web service-to-host architecture. The Continuous Measurement and Logging LabVIEW Sample Project (available in LabVIEW 2012 and higher) is based on the queued message handler architecture and demonstrates the scalable nature of this architecture. Below are the simple steps that can be taken to extend this Sample Project to include reading and writing data from the Data Dashboard app.
- Create a new Sample Project by selecting Create Project from the Start Screen. Then select the Continuous Measurement and Logging example.
- You can then create an Icon that will be continuous throughout your entire project.
- Here you have a working example, if you open the main VI you can run the project with sample data and see the way that the user interacts.
- Explore the way that the message handler takes user generated events and enqueues commands for the consumer loops to handle.
- To modify the example to handle requests from Data Dashboard, messages will be enqueued from a web service VI. The queues will need to be accessed from the web service VI, therefor we must name the queues.
- Then create a new web service by right-clicking on My Computer and selecting New>Web Service
- A new Web Service will show up as a project item, right click on the web resources folder and select to create a new VI (as seen below).
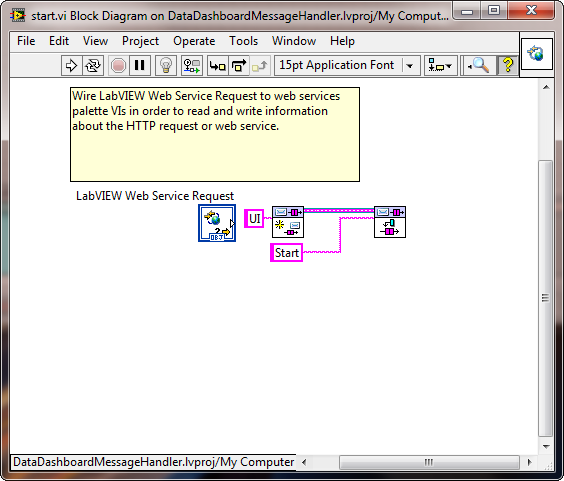
- Add the code necessary to obtain a reference to the queue and then enqueue the message appropriate for the button you are calling. In the case shown below it will be the Start Button on Data Dashboard so the message is “Start”.

- Create VIs for all of the buttons you plan to replicate on Data Dashboard.
- To receive the data display in Data Dashboard, the notifier will also have to be named. The same notifications can then be read in another web method that can be polled from Data Dashboard. When polling from data dashboard the max update rate is .3 seconds. This means that to see the full data set, the sampling rate must be around the same rate or slower. To see this, change the frequency of the sine wave being generated.
- You can now build your executable that includes the Web service. Right click on build specification and select, New >> Application (EXE).
- In the Build Specification Properties dialog, give the executable a name. Select Source Files on the left hand side and choose main.vi as the start up VI.
- Select Web Service on the right hand side and select to include the web service you just created. Then build the exe.
- Once the exe is built, explore the file location and run the exe. Note: to be have the ability to browse the the web service in Data Dashboard you must complete this step.
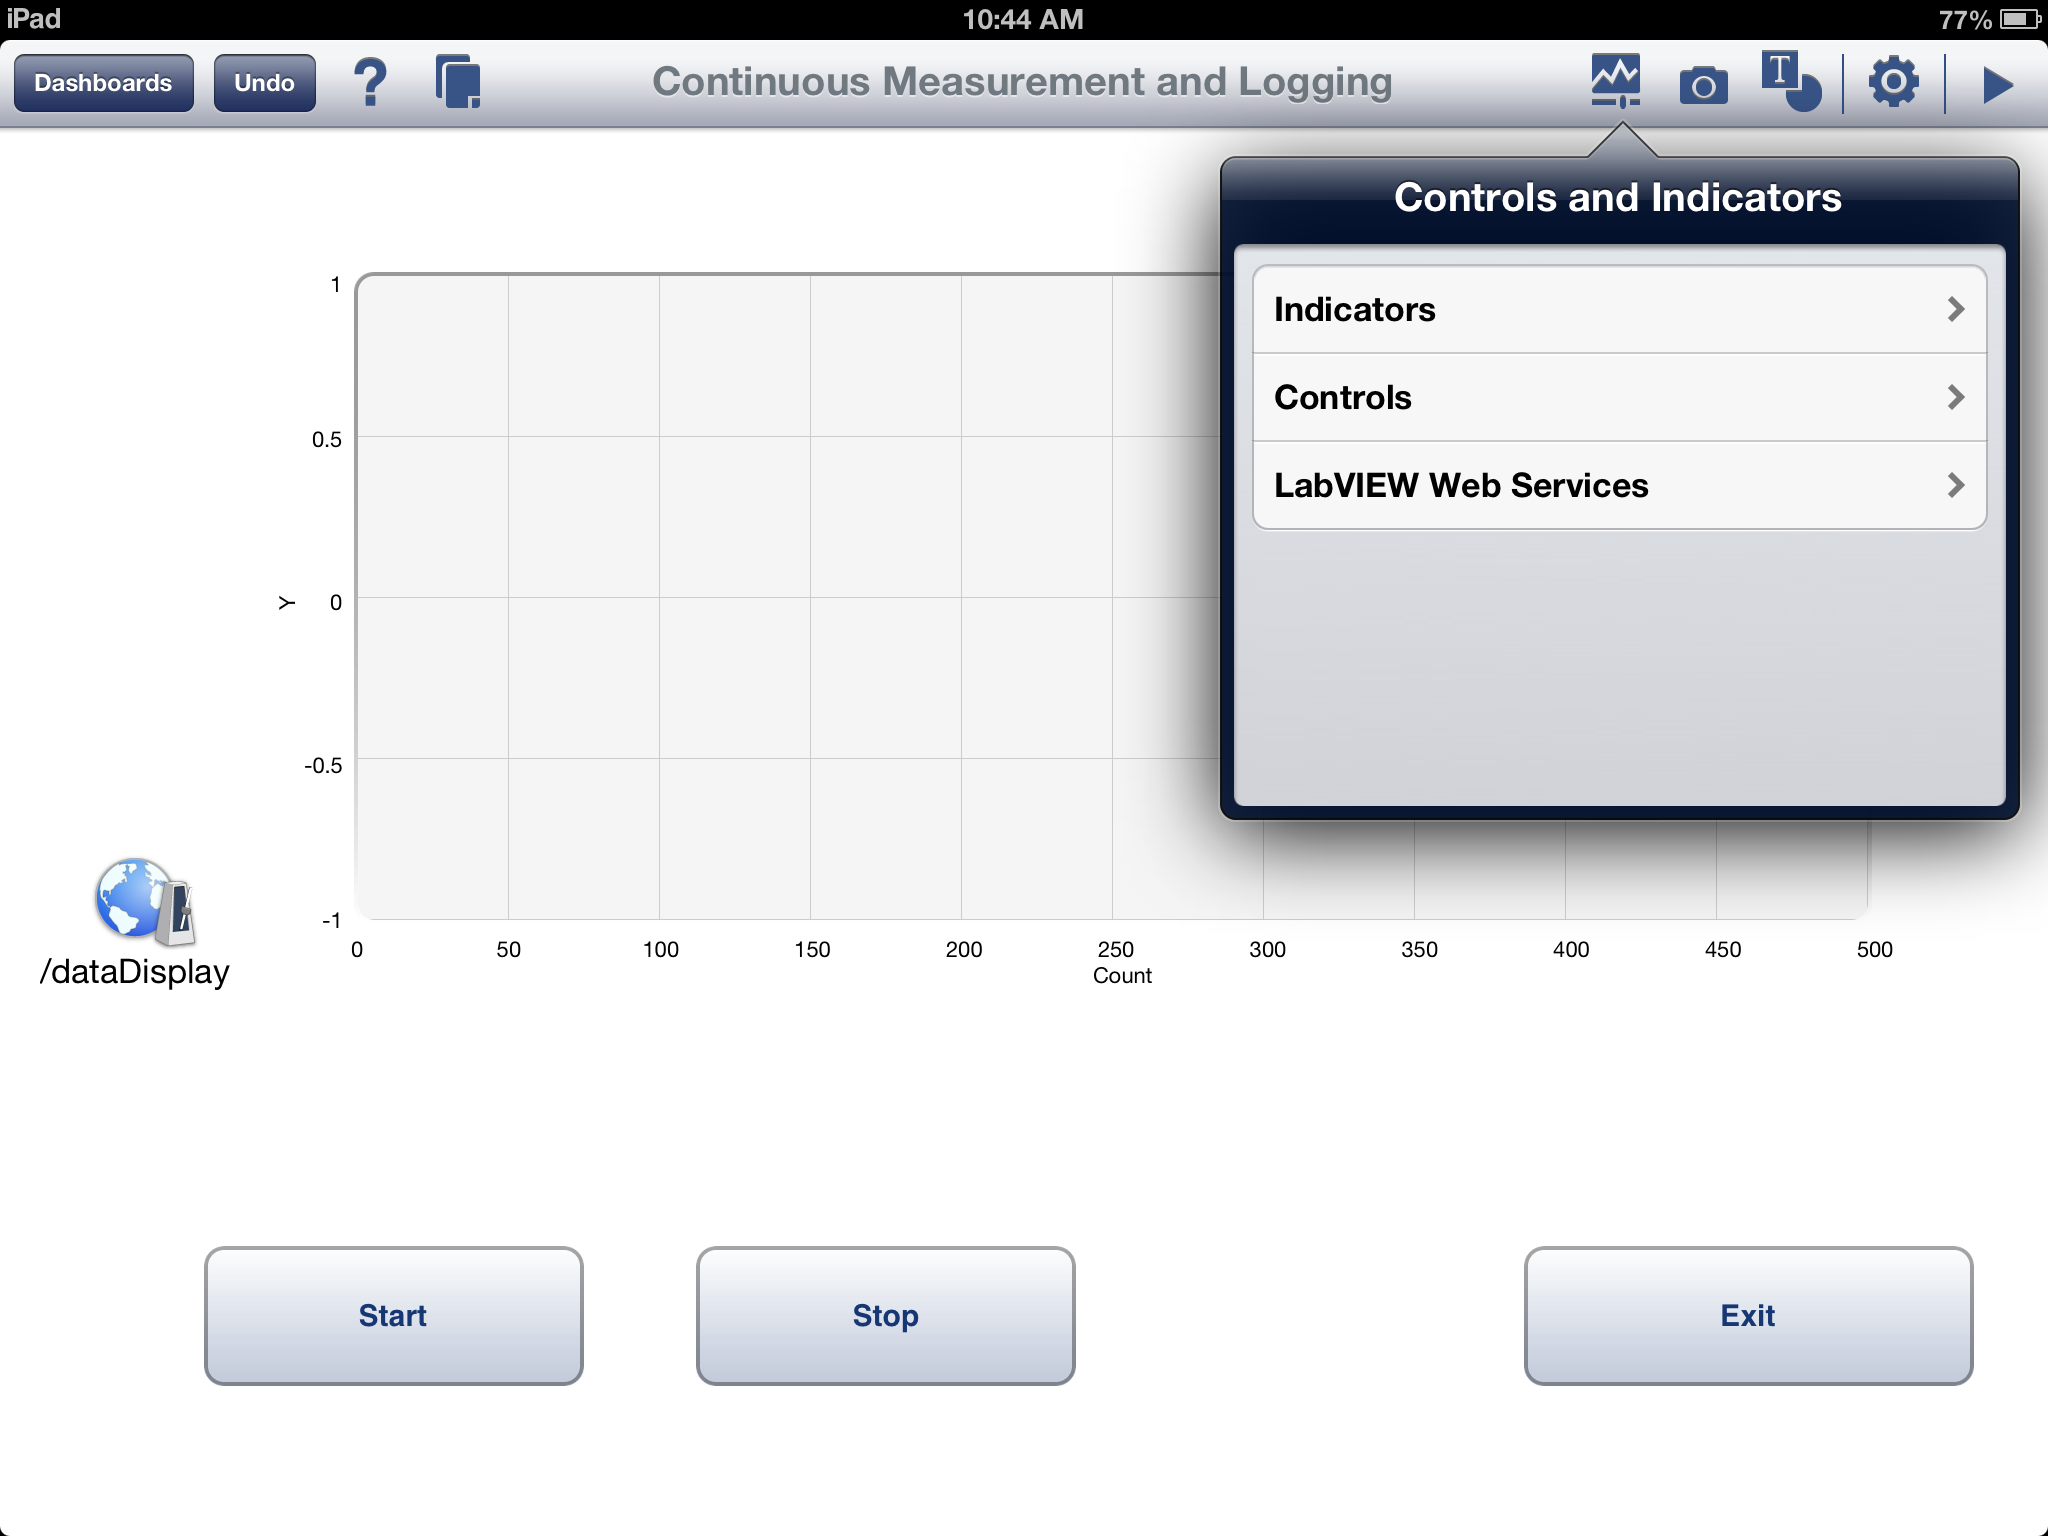
- In Data Dashboard, set up a Dashboard that has the desired interface. In this example, create an interface that matches the LabVIEW interface.

- Add a new Web Service call by selecting Controls and Indicators, LabVIEW Web Services, Call Web Service. These will be the calls to your Start, Stop and Exit web method VIs.
- Once you have added the button, select it and select the green variable indicator below. A menu will appear that will allow you to select the web service that will be called with the button. Add one of these for each of the interactions that you added to the LabVIEW Web Service
- For the display, add a new Web Service Poll by selecting Controls and Indicators, LabVIEW Web Services, Poll Web Service.
- Select the green button below and choose the data web service and select the calling interval. The return from the web service will then appear (in green) next to the poll and link that to the Data Dashboard indicator you would like to update.