Background
The time-domain representation gives the amplitudes of the signal at the instants of time during which it was sampled. However, in many cases, you need to know the frequency content of a signal rather than the amplitudes of the individual samples.
The fast Fourier transform (FFT) provides a method for examining a relationship in terms of the frequency domain. Fourier’s theorem states that any waveform in the time domain can be represented by the weighted sum of sines and cosines. The same waveform then can be represented in the frequency domain as a pair of amplitude and phase values at each component frequency.
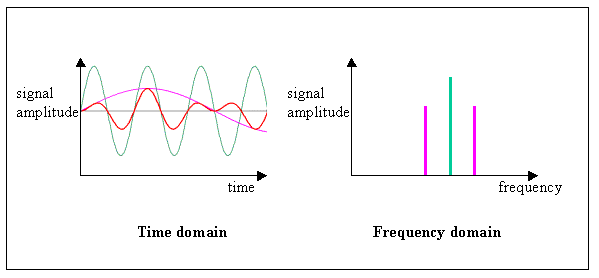
Figure 1. Time Domain Versus the Frequency Domain
In the frequency domain, you can separate conceptually the sine waves that add to form the complex time-domain signal. Figure 1 shows single-frequency components, which spread out in the time domain, as distinct impulses in the frequency domain. The amplitude of each frequency line is the amplitude of the time waveform for that frequency component. The representation of a signal in terms of its individual frequency components is the frequency-domain representation of the signal. The frequency-domain representation might provide more insight into the signal and the system from which it was generated.
Why It Matters
The samples of a signal obtained from the data acquisition device constitute the time-domain representation of the signal. Some measurements, such as noise or harmonic distortion, are difficult to quantify by inspecting the time waveform. When the same signal is displayed in the frequency domain by an FFT, you easily can measure the harmonic frequencies and amplitudes.
If you have a noise in your measured signal, you can move from the time domain into the frequency domain to isolate the disturbance in your measurement.
Measuring a Signal
Using LabVIEW and NI data acquisition devices, you can acquire data and present it on the user interface in minutes to analyze and explore the measured signal. Using NI myDAQ, you can configure the device on the PC and acquire an analog signal as follows:
- Connect the NI myDAQ or a data acquisition DAQ device to your PC
- Connect the signal of interest to Analog Input 0 (ai0)
- Create a new VI in LabVIEW
- Open LabVIEW and select File»New VI
- Place a DAQ Assistant on the block diagram
- Right-click on the block diagram and select Express»Input»DAQ Assistant
- Place the DAQ Assistant on the block diagram by left-clicking on it
- Configure the DAQ Assistant type
- Select Acquire Signals
- Select Analog Input
- Select Voltage
- Select Dev1 (or the name of your device if not Dev1)
- Select ai0 for Analog Input 0
- Configure acquisition settings
- Enter 10k for Number of Samples
- Enter 10k for Sample Rate
- Click Run to test your settings
- Click OK to finish the DAQ Assistant
- Create a graph indicator to view data
- Right-click on the Data output terminal of the DAQ Assistant
- Select Create»Graph Indicator
- Run the VI by pressing the Run button and visualize the results
- Adjust the Graph Indicator appearance as desired
- Change Acquisition Mode to Continuous
a. Double-click the DAQ Assistant
b. Change Acquisition Mode from N Samples (Finite) to Continuous
c. Select OK to finish the DAQ Assistant
d. Select Yes to auto place the While Loop around the DAQ Assistant - Run the VI to visualize the data on the front panel
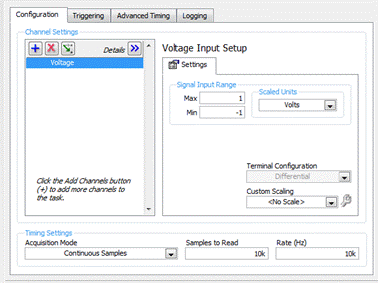 Figure 2. Configure the DAQ Assistant
Convert to the Frequency Domain
To find the noise on the measured signal, you need to see the signal in the frequency domain. Using the Spectral Measurements Express VI, convert the time-domain signal into the frequency domain. To measure the peak, the VI analyzes all of the frequencies of your signal and displays them on your graph.
- Place a spectral measurements function on the block diagram
a. Create a spectral measurements function by navigating to Express»Signal Analysis»Spectral in
the Functions palette; place the function on the block diagram
b. In the Configure Spectral Measurements window, change the Selected Measurement to Magnitude
(Peak) - Connect the functions and test the VI
a. Wire the data terminal of the DAQ Assistant to the Signals input of the spectral measurements
b. Wire the FFT – (Peak) output of the spectral measurements to the input terminal of the waveform graph
c. Return to the front panel and click the Run button (the white arrow in the upper left corner)
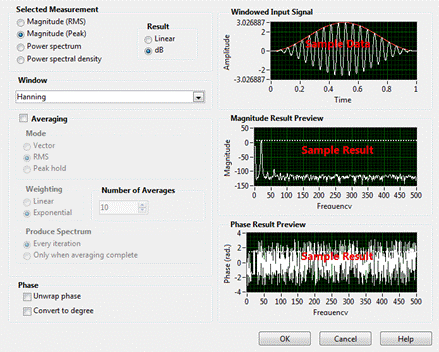 Figure 3. Configure the Spectral Measurement
Filter the Unwanted Signal
Once you have identified the unwanted components of the signal, you can remove the noise and keep the signal of interest. A filter removes an unwanted component or feature but does not alter the original frequencies. Using a Lowpass Filter Express VI, you can pass all frequencies below a specified value while removing higher frequency values. While running LabVIEW, you can interact with the user interface and interact with and modify the variable of the cutoff frequency as you acquire the signal.
- Place a filter on the block diagram
a. Return to the block diagram and add a filter from
Express»Signal Analysis»Filterb. Leave the
Filtering Type as the default Lowpass, but change
Cutoff Frequency (Hz) to 400
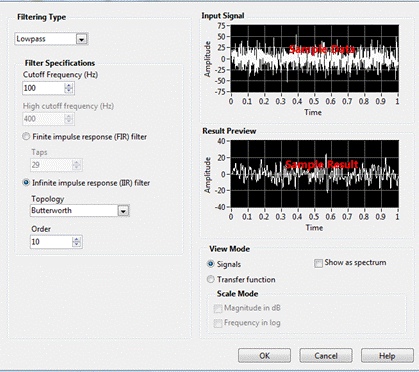
Figure 4. Configure the Filter Express VI
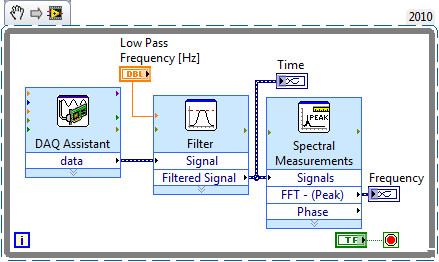 Figure 5. LabVIEW VI for the Frequency Domain
Right-click on the above VI snippet and select Save Image As... Locate the file on your hard disk and drag the file icon onto your LabVIEW block diagram. LabVIEW automatically generates the code from the VI snippet.