Before you start
To replicate the exercises in this document, the user needs to have myDAQ plugged in. Also, this document requires the installation of the myDAQ Software Suite. The user should have all the components installed in this specific order: LabVIEW, Circuit Design Suite, DAQmx.
The exercises also require the use of a breadboard, a capacitor (.1uF), a resistor (1kohm), and wires.
NI myDAQ Design Template
You can access myDAQ instrumentation in Multisim by opening the “NI myDAQ Design” template. This can be found in Multisim main toolbar at File>>New>>NI myDAQ Design
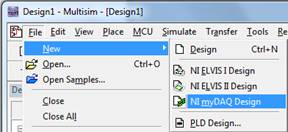
Figure 1: Launching the NI myDAQ Design Template
Troubleshooting: If you can’t find the template, reinstall DAQmx. (Multisim needs to be installed prior to the installation of the DAQmx software)
The template, once open, will have two connecting slots: the myDAQ right slot and the myDAQ bottom terminals. These will represent the actual panels or slots that are available on myDAQ. The template allows you to draw wires connecting your captured schematic with the lines on the virtual myDAQ device, the same way you would connect your breadboard circuit to the actual myDAQ device.

Figure 2: NI myDAQ Right Slot

Figure 3: NI myDAQ Bottom Terminals
Also, Multisim integrates NI Elvismx instrumentation within this template, allowing the users to simulate their schematic capture using familiar interfaces. Furthermore, the users can acquire real data off of their myDAQ devices and compare it to their simulated ones.
Enabling and Disabling myDAQ Instruments in Multisim
You should be able to tell whether a specific instrument is enabled or disabled by identifying the red X sign on its respective icon on the myDAQ right slot. The red X sign will mark a disabled instrument. To enable or disable an instrument, right-click on the icon and click on “NI myDAQ Instrument Enabled in Simulation.”
You can find more information about the instruments in the NI ELVISmx Help.
Enabling an Instrument
Figure 4 shows you how to enable the instrument. Notice the red X mark on the side of the icon.


Figure 4: Enabling a Disabled Instrument
You can also enable a specific instrument by double-clicking on the corresponding icon. The instrument will pop out.
NOTE: It is important to note that Bode and Scope will not simulate any signals if the FGEN is not activated first.
Disabling an Instrument
Figure 5 shows you an enabled instrument; notice the red X mark is no longer present. Right clicking the icon will show a check mark next to the “NI myDAQ Instrument Enabled in Simulation” prompt confirming that the instrument is in fact enabled. To disable, left click on the mark to uncheck it.


Figure 5: Disabling an Enabled Instrument
Using Bode with FGEN
This section will present an example on how to use the BODE instrument in the Multisim environment.
Introducing the Example
Draw the schematic capture as shown in figure 4, and make a prototype that corresponds to it.
Follow these steps to reproduce our example:
- Place a capacitor (.1uF) in series with a resistor (1kohm)
- Connect the end of the resistor to GND, AI0-, and AI1-
- Connect the end of the capacitor to A0 and AI0+
- Finally, connect AI1+ between the capacitor and the resistor.
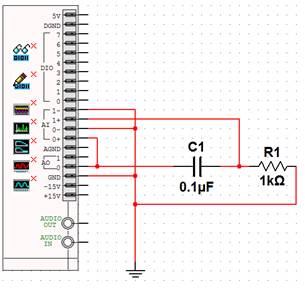
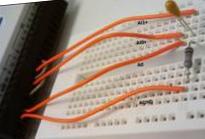
Figure 4: Schematic Capture and Prototype
Replicate these steps on a breadboard to prototype the circuit. Figure 4 shows both the schematic capture in Multisim and its corresponding prototype on a breadboard.
Simulated Data: the Schematic capture Simulation using Daqmx instruments
To simulate the schematic capture using BODE and FGEN, enable them as shown in the previous section of this document. Double-click the BODE instrument for its window to pop-out. Run the simulation by pressing F5 or by clicking on the run button in the menu toolbar. 
Stop the simulation by pressing on the stop button in the menu toolbar or under >Simulate>Stop from the drop down menu.
The result of the schematic capture simulation should appear as shown in Figure 5.
The simulated data should appear in green. Note that under Instrument Control Box in the BODE window, the device should be “Simulate NI myDAQ.”
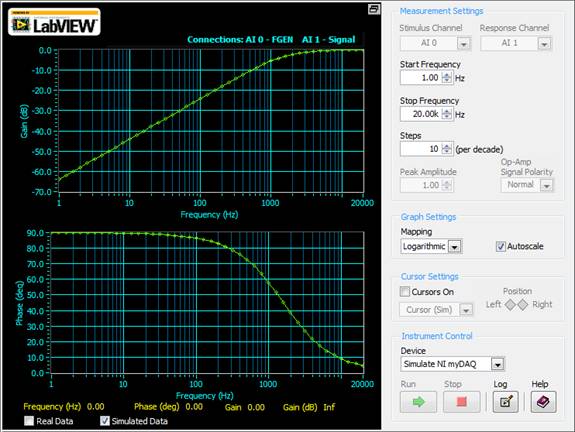
Figure 5: BODE Analyzer plot of the schematic capture simulation
Real Data: Data Acquistion using DAQmx instruments
After successfully simulating the schematic capture, you could acquire the real data from myDAQ and compare the results. Make sure you have stopped the simulation to be able to proceed.
Under Instrument Control, choose the device corresponding to “NI myDAQ.” Figure 6 illustrates this step.
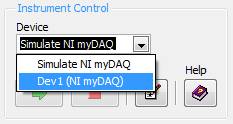
Figure 6: Selecting myDAQ to Get Real Data
Figure 7 shows how the instrument controls become enabled when selecting myDAQ from the Device menu. The instrument controls will allow you to run, stop, and log your real data.
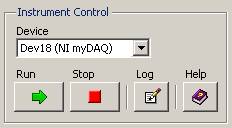
Figure 7: Instrument Controls Enabled after Instrument Selection
Push the Run control on the Instrument Control Box to acquire data. The time the process takes will depend on the settings chosen.
Figure 8 illustrates the plot of the simulated data against the acquired or real data.
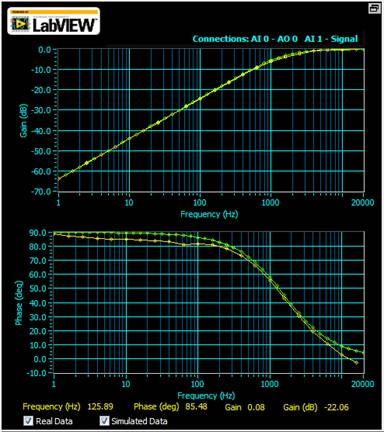
Figure 8: Real Data vs. Simulated Data
Troubleshooting: Notice that the real data will appear in yellow and the simulated is green as discussed before. If any of the data does not appear, make sure that their respective plot is enabled on the bottom as shown in Figure 9.

Figure 9: Plot Enabled or Disabled Legend
Using Scope with FGEN
This section will present an example on how to use the SCOPE and FGEN instruments in the Multisim environment.
Introducing the Example
Draw the schematic capture as shown in Figure 10, and make a prototype that corresponds to it.
Follow these steps to reproduce our example:
- Connect AGND to AI0-
- Connect A00 to AI0+
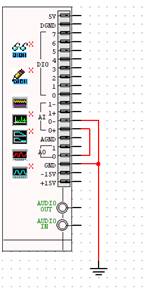
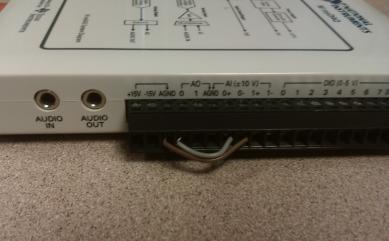
Figure 10: Schematic Capture and Prototype
Simulated Data: the Schematic capture Simulation using Daqmx instruments
To simulate the schematic capture using SCOPE and FGEN, enable them. Double-click the SCOPE and the FGEN instruments and their respective windows will pop-out. Run the simulation by pressing F5 or by clicking on the run button in the menu toolbar. 
In the “Waveform Settings”, click the square wave form and change the frequency to 500hz in the FGEN instrument. Also, make sure the amplitude is equal to 10V. Check Figure 11.
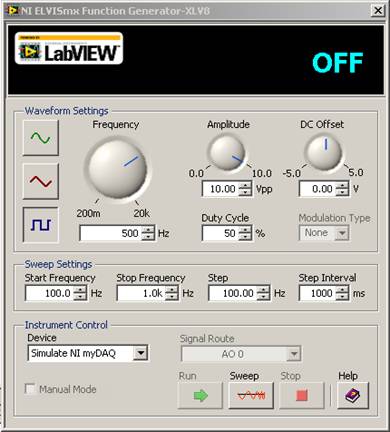
Figure 11: FGEN Window
Change the Channel 0 Settings to match Figure 12: change the “Scale Volts/Div” to 5V, switch the Trigger Type to Edge, and select 1ms/Div under “Timebase.”
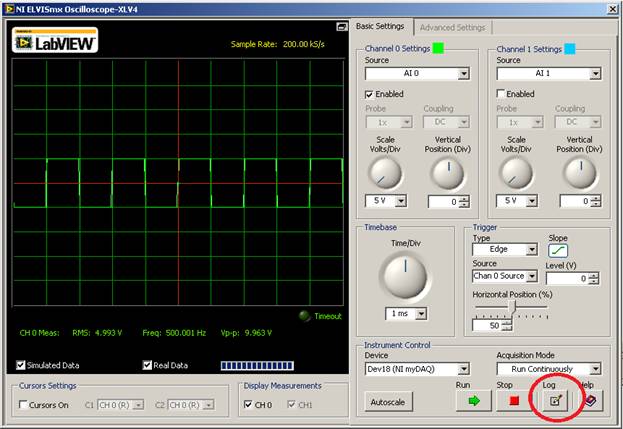
Figure 12: SCOPE Window
Stop the simulation by pressing on the stop button in the menu toolbar or under >Simulate>Stop from the drop down menu.
The result of the schematic capture simulation should appear as shown in Figure 12.
NOTE: Make sure the correct channel is enabled under “Channel Settings”. In our case, we are using AIO under channel 0. The simulated data should appear in green. Note that under Instrument Control Box in the BODE window, the device should be “Simulate NI myDAQ.”
Real Data: Data Acquisition using DAQmx instruments
After successfully simulating the schematic capture, you could acquire the real data from myDAQ and compare the results. Make sure you have stopped the simulation to be able to proceed.
Under “Instrument Control” of each instrument, select the corresponding “NI myDAQ” allowing both the FGEN and the SCOPE to access the device.


Figure 13: Instrument Controls Enabled in FGEN (left) and SCOPE (right)
Push the Run control on the Instrument Control Box on the FGEN and the SCOPE. The time the process takes will depend on the settings chosen.
The settings chosen while simulating the schematic capture should remain the same, and the resulting plot of simulated data vs. real data is illustrated in Figure 14.
Push the “Stop” control under the “Instrument Control” Box on both the FGEN and the SCOPE. Also, push the “Log” control to log the file and save it as square500.txt, this file will be used for the “Using DSA with ARB” section.

Figure 14: Real Data vs. Simulated Data
Troubleshooting: Notice that the real data will appear in blue and the simulated is light green as discussed before. If any of the data does not appear, make sure that their respective plot is enabled on the bottom as shown in Figure 9.
Using DSA with ARB
This section will present an example on how to use the DSA and ARB instruments in the Multisim environment.
Introducing the Example
Use the same example as introduced in the previous section.
Draw the schematic capture as shown in Figure 10, and make a prototype that corresponds to it.
Follow these steps to reproduce our example:
- Connect AGND to AI0-
- Connect A00 to AI0+
Simulated Data: the Schematic capture Simulation using Daqmx instruments
To simulate the schematic capture using DSA and ARB, disable FGEN and SCOPE and double-click the DSA and the ARB instruments and their respective windows will pop-out.
In the ARB window, click on “Click to Launch” under the “Waveform Editor.” Follow these instructions:
1) Go to _File>Open to open the square500.txt created in the previous exercise.
2) In the “Open Text File Wizard” make sure Tab is selected and change the column number to 2, Figure 15.
3) You should be able to see the square wave. Click ok.
4) In the “Waveform Editor”, go to _File>Save As and select “Waveform file” as the file type (‘*.wdt’). Click Next.
5) Choose the sample rate to be 10Khz and save the file as square500.wdt, refer to Figure 16.
6) Close the “Waveform Editor.”
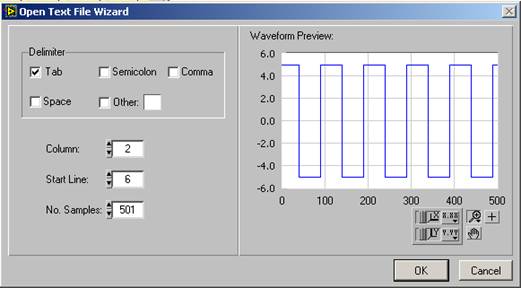
Figure 15: Open Text File Wizard in the Waveform Editor; Step 2.
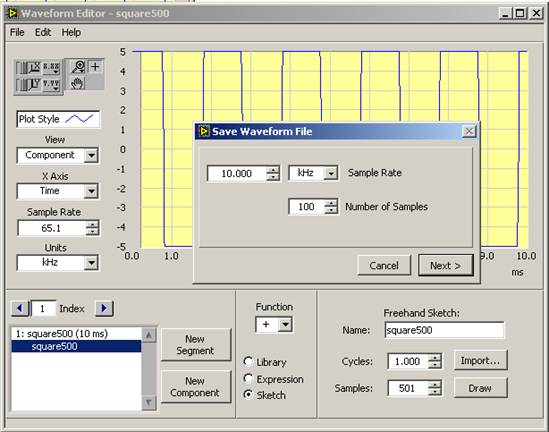
Figure 16: Choosing the Sample Rate on Saving
Enable the AO 0 and open the file “square500.wdt” that we just created. Input 10k into the “Update Rate” in the “Timing and Triggering Settings” as shown in Figure 17.
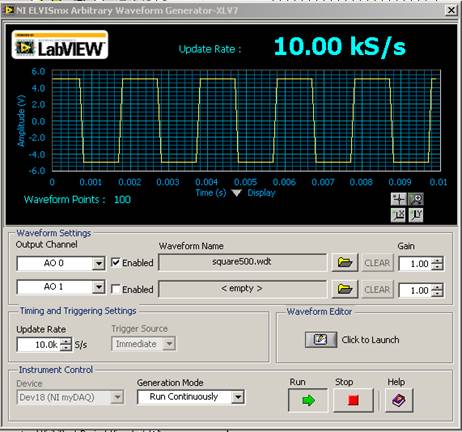
Figure 17: ARB Window
In the DSA window, set the parameters as shown in Figure 18. Set frequency span to 1khz in the “FFT Settings.” In “Averaging”, select None under Mode. Select a Hanning window with 200 resolution lines.
Run the simulation by pressing F5 or by clicking on the run button in the menu toolbar. The result of the schematic capture simulation should appear as shown in Figure 18. This process might take a little time, so be patient.
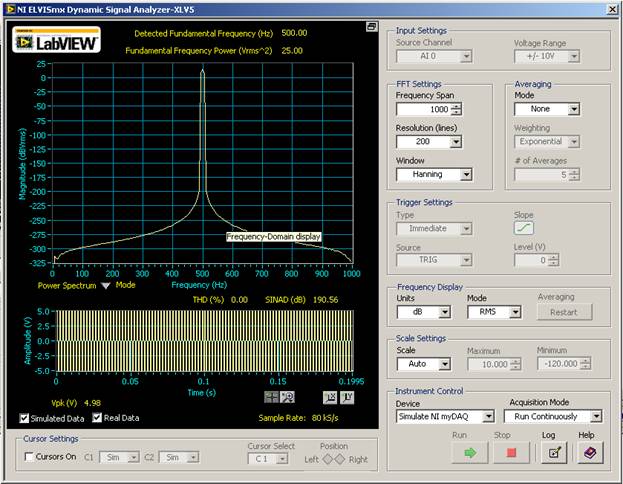
Figure 18: DSA Window
NOTE: The simulated data should appear in green. Note that under Instrument Control Box in the BODE window, the device should be “Simulate NI myDAQ.”
Stop the simulation by pressing on the stop button in the menu toolbar or under >Simulate>Stop from the drop down menu.
Real Data: Data Acquisition using DAQmx instruments
After successfully simulating the schematic capture, you could acquire the real data from myDAQ and compare the results. Make sure you have stopped the simulation to be able to proceed.
Under “Instrument Control” of each instrument, select the corresponding “NI myDAQ” allowing both the ARB and the DSA to access the device.
Push the Run control on the Instrument Control Box on the ARB and the DSA. The time the process takes will depend on the settings chosen.
The settings chosen while simulating the schematic capture should remain the same, and the resulting plot of simulated data vs. real data is illustrated in Figure 19.
Push the “Stop” control under the “Instrument Control” Box on both the ARB and the DSA.
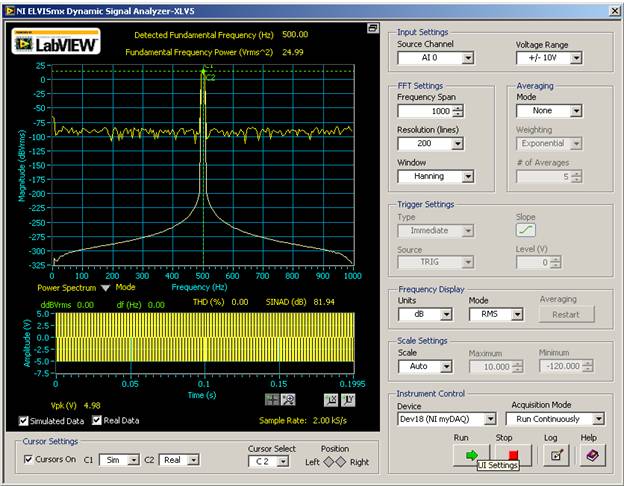
Figure 19: Real Data vs. Simulated Data
Troubleshooting: Notice that the real data will appear in yellow and the simulated is in white. If any of the data does not appear, make sure that their respective plot is enabled on the bottom as shown in Figure 9.