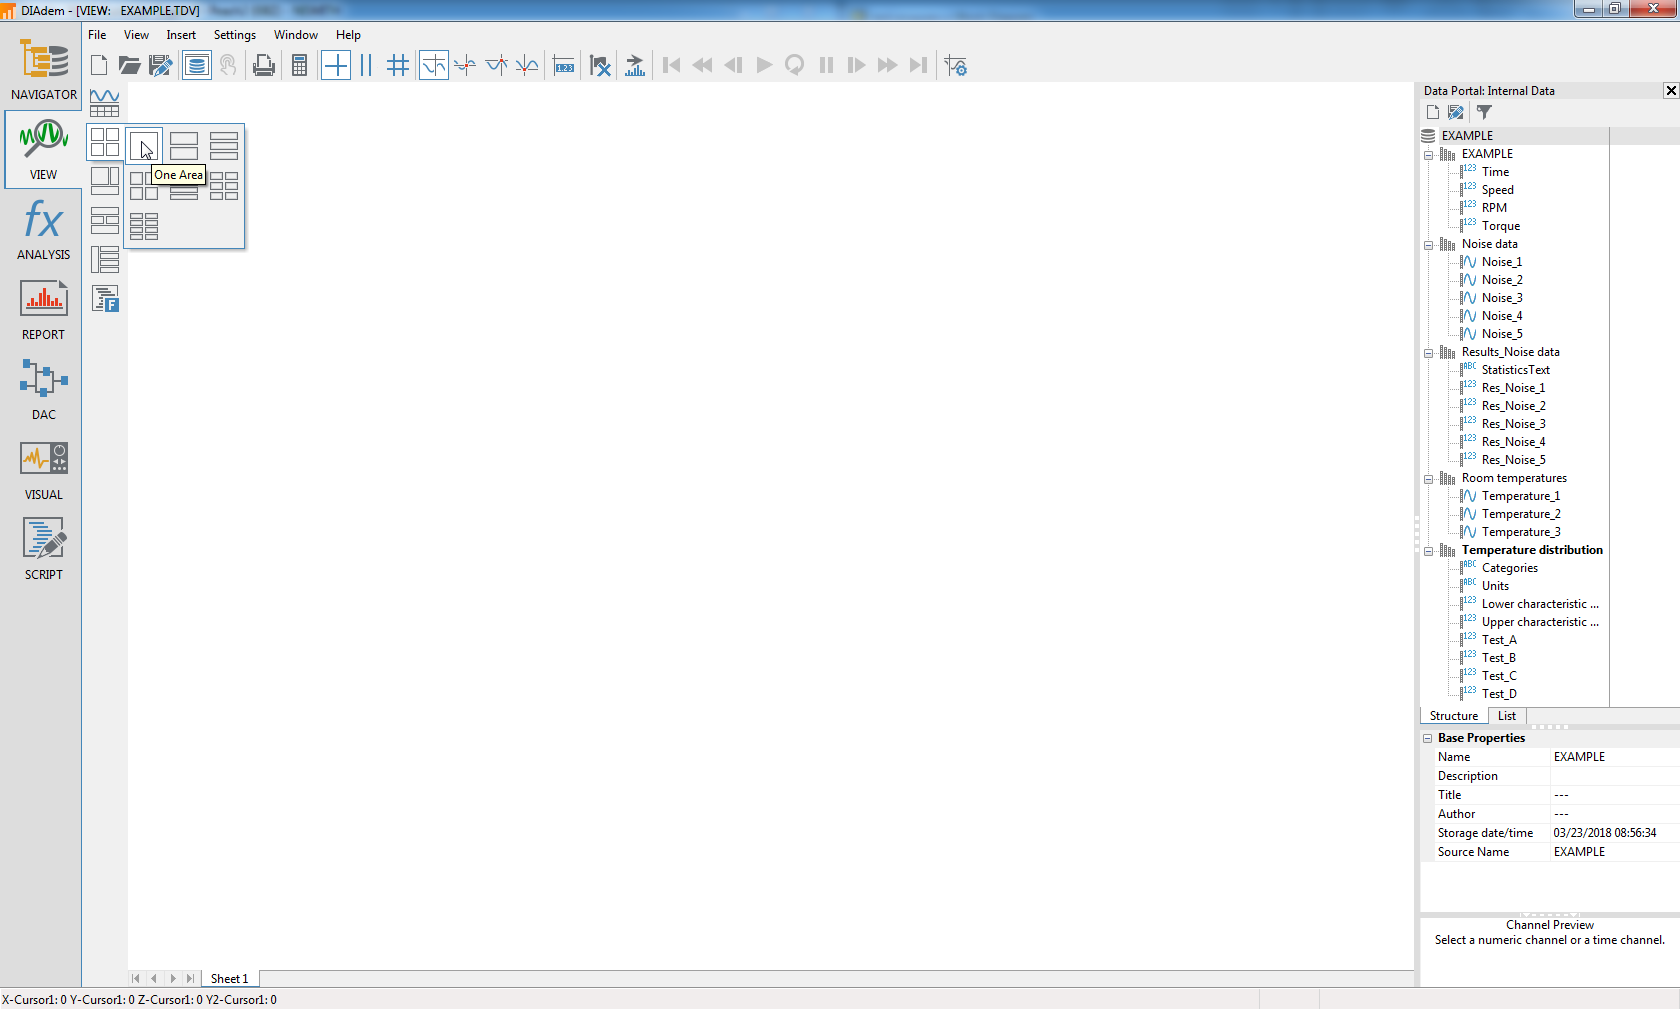
The simplest way to plot data in DIAdem is using the VIEW tab. From the VIEW tab, start by clicking the
New Layout button in your top toolbar.

Next, you'll want to select how many partitions you want to have in your workspace. For this exercise, we will use a single partition for our graph.
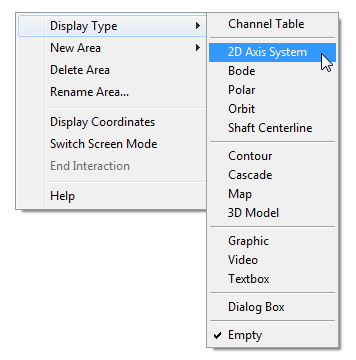
Partitions are used to hold different display types in DIAdem, but we must first select what type of display to use. To do this, right-click your partition and select
Display Type >>
2D Axis System.
Now, we have a graph to plot our data on. To plot data, select it from your Data Portal and drag it onto your plot. To select multiple channels, hold Ctrl as you select channels. Note that the first channel you select will be used as the X-axis, and all other channels will be used as Y-axis data.
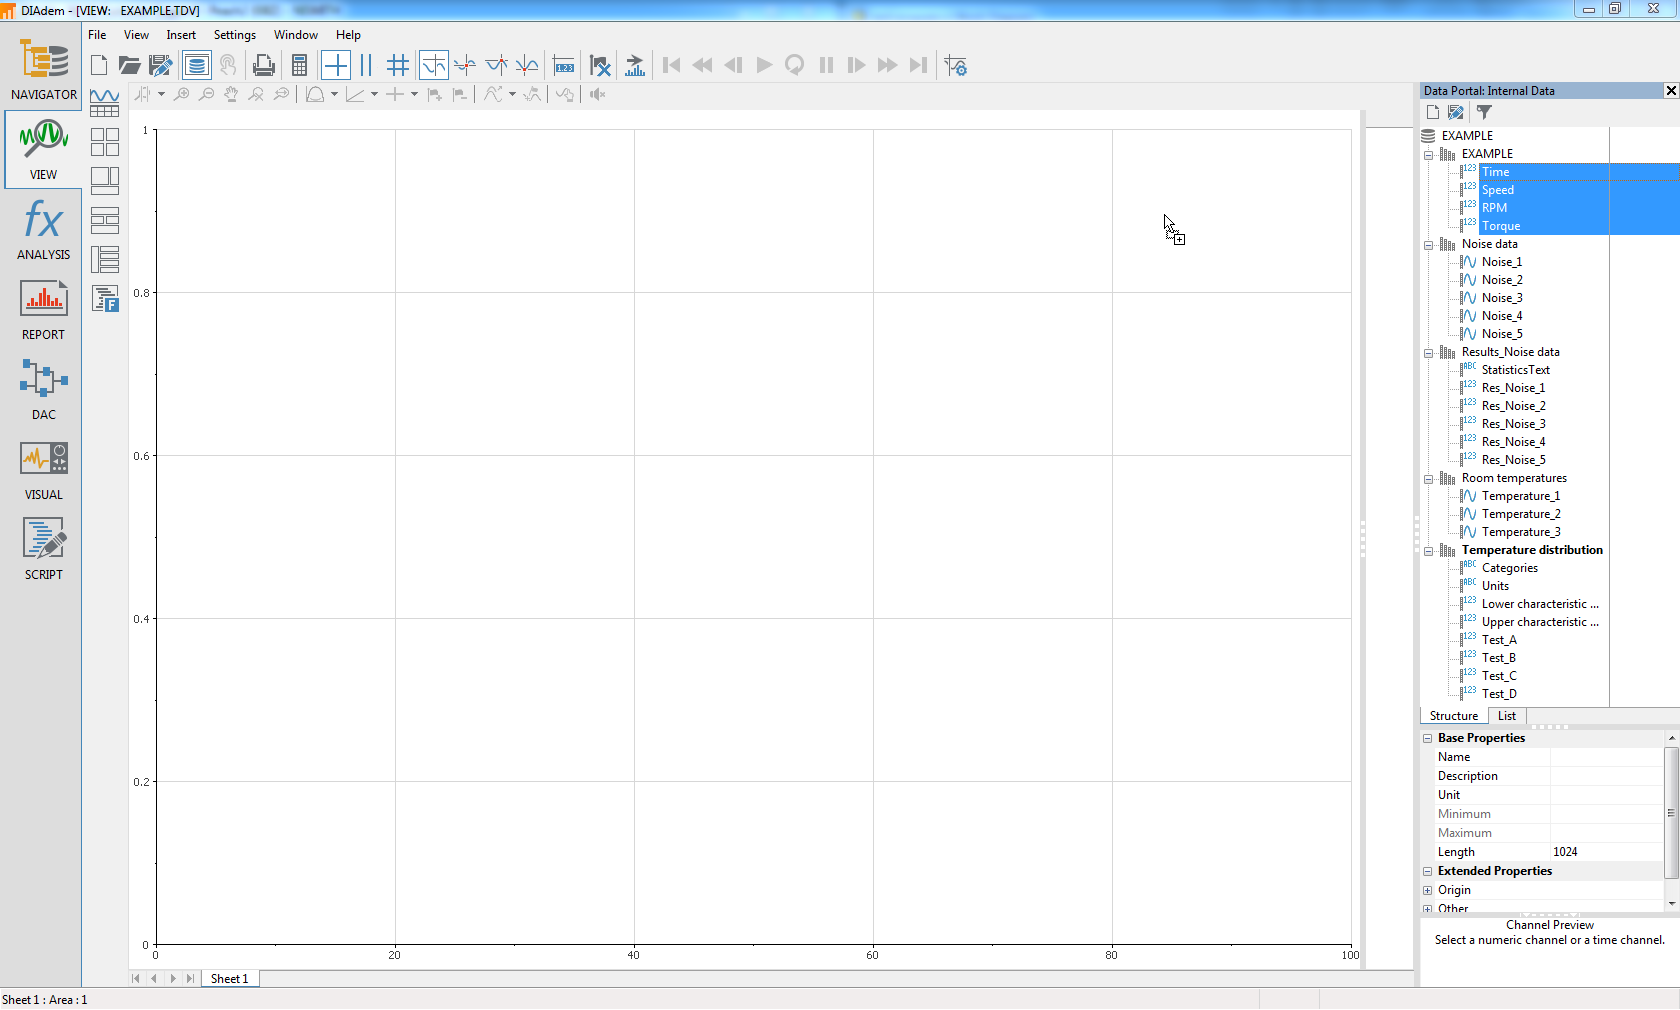
Your data will now be plotted on the graph. For more information about customizing the graph to best represent your data, see
DIADEM Help - 2D Axis System.