To monitor OPC diagnostic information, there are two options. You can enable the diagnostic log and read the information from that log, or you can actively monitor diagnostic information in real time or the Historical View using NI OPC Servers.
To enable the diagnostic log, you'll need to access the Configure OPC Client I/O Server window. In the Project Explorer:
- Navigate to the library containing the OPC Server.
- Right click the OPC Server.
- Select Properties.
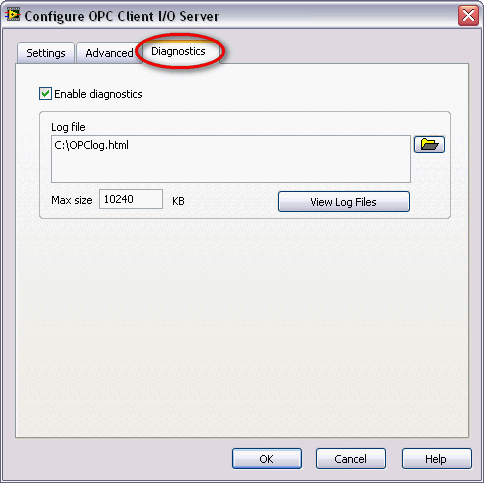
- When the Configure OPC Client I/O Server dialog box opens, select the Diagnostics tab and
- Place a check mark on the Enable diagnostics
- Browse for an appropriate path to save the log file.
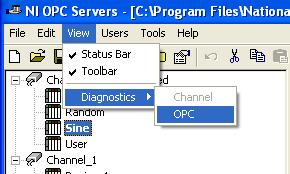
To access the OPC diagnostics window:
- Launch NI OPC Servers by accessing Start»Programs»National Instruments»NI OPC Servers»NI OPC Servers.
- Once launched select View»Diagnostics»OPC from the menu.
- In the Diagnostic window you can start and stop recording diagnostic information, quickly search for specific text and use the filter dialog to select which events you want to capture.