Solution
A Waveform Chart can not be configured to do this. However, you can make an XY Graph that will scroll data top-to-bottom.
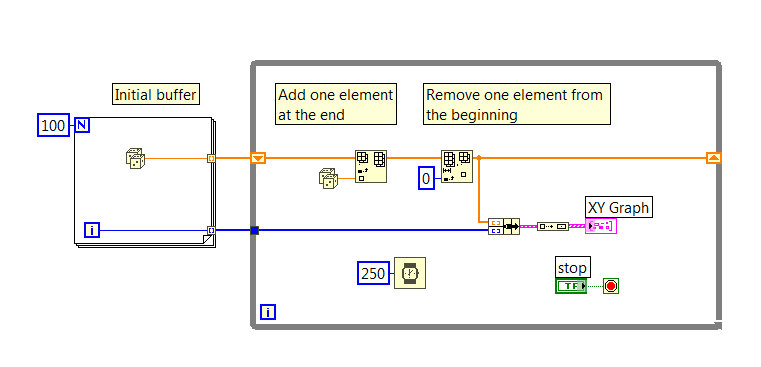
In order to do this, you will need to use a circular array. A circular array has a fixed size, which means that when you add one element at the end of the array, you must also remove one element from the beginning of the array. In this way a circular array of 100 elements will always have the most recent 100 elements of incoming data. If you swap the X and Y elements of the array, you can use an XY graph to display the data from top to bottom.
The VI illustrated below shows how to do this using random numbers: