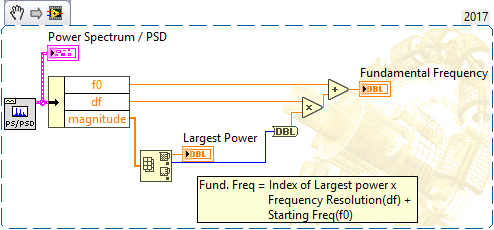
Solution
The output from FFT Power Spectrum and PSD.vi is a cluster containing two double precision elements, and a double precision array:
- f0: Starting Frequency
- df: Frequency Resolution
- Magnitude: Array of Power values for each frequency
In order to find the fundamental frequency we first need to find the largest power/amplitude within
Magnitude and its index in the array. The index then be can used with f0 and df as shown in the following equation to find the fundamental frequency.Fundamental Frequency = Index of Largest Power x Frequency Resolution(df) + Starting Frequency(f0) The following code shows how the cluster can be used to find the fundamental frequency: