Este conteúdo não está disponível em seu idioma preferido.

O conteúdo é exibido em outro idioma disponível. Seu navegador pode incluir recursos que podem ajudar a traduzir o texto.

How to Use Process Monitor to Capture a LabVIEW Crash

Updated Mar 21, 2018

Reported In

Software

  • LabVIEW
  • TestStand
  • VeriStand

Other

LabVIEW crashes when I perform a certain action. However, when I restart LabVIEW I am not prompted to investigate internal errors. Also, there are no text files in \My Documents\LabVIEW Data\lvfailurelog. How can I obtain additional information about the crash?

Issue Details

Process Monitor is an advanced monitoring tool for Windows that shows real-time file system, Registry, and process/thread activity. You may obtain Process Monitor from Microsoft's website at this link: Microsoft TechNet: Process Monitor. Process Monitor is downloaded as a ZIP file. Unzip the contents to a new folder and run Procmon.exe

From the menu, click 
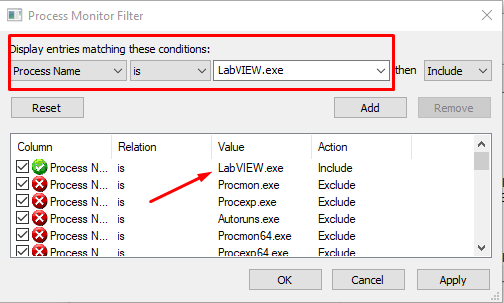
Filter»Filter... In the Process Monitor Filter window, select Process Name, then select is, LabVIEW.exe, and finally Include; then click Add followed by OK.

Solution

Back in the Process Monitor window, there are five types of events that can be obtained. For maximum reporting, enable the Show Registry Activity, Show File System Activity, Show Network Activity, Show Process and Thread Activity, and Show Profiling Events from the toolbar.

A great deal of information is obtained, and it may be appropriate to enable only one or two of the events. It is recommended that you clear Process Monitor immediately before you perform the action that causes LabVIEW to crash. This way, the log that you will save from Process Monitor will contain the most relevant information only.

It is recommended to save the log in the Comma Separated Values (CSV) file format so that the log can be shared with support engineers if necessary.