Solution
There are several strategies to accomplish this. Generally, a Waveform Chart or Graph can be used to display continuous data; however, if you would like to use the XY graph, the goal is to get your data into the same format. The required data format can be seen through context help by pressing Ctrl-H and hovering your mouse over the input terminal of the XY graph.
Shown below are four different strategies for displaying the data:
- Collect all the data into a single array using a For Loop and display the data on the XY graph in a single snapshot.
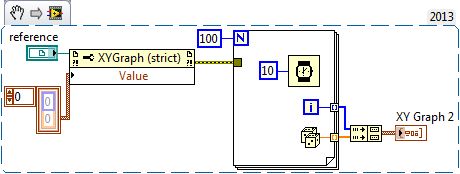
Note: This image is a LabVIEW snippet, which includes LabVIEW code that you can reuse in your project. To use a snippet, right-click the image, save it to your computer, and drag the file onto your LabVIEW diagram.
- Save the information into an array that continuously updates, and continuously refresh the XY display.
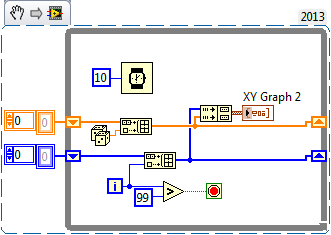
Note: This image is a LabVIEW snippet, which includes LabVIEW code that you can reuse in your project. To use a snippet, right-click the image, save it to your computer, and drag the file onto your LabVIEW diagram.
- Represent each XY data point in a cluster. Then, create an array of these clusters to represent an entire data set. This method makes it possible to display multiple data sets on a single XY graph.
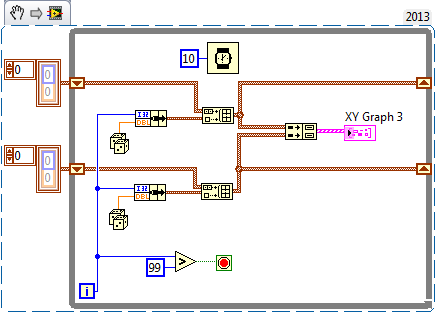
Note: This image is a LabVIEW snippet, which includes LabVIEW code that you can reuse in your project. To use a snippet, right-click the image, save it to your computer, and drag the file onto your LabVIEW diagram.
- Use a case statement in the while loop so that you can update the arrays of information in the same while loop, but at separate points in time. This method makes it possible to plot multiple data sets on a single XY graph, but at separate times.
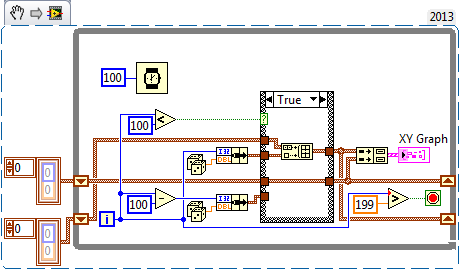
Note: This image is a LabVIEW snippet, which includes LabVIEW code that you can reuse in your project. To use a snippet, right-click the image, save it to your computer, and drag the file onto your LabVIEW diagram.
- By using the build array function before bundling, the value constant is converted into an array with just one number. Two of these single number arrays can then be bundled together to create a single XY point data, ready for the XY graph to accept.
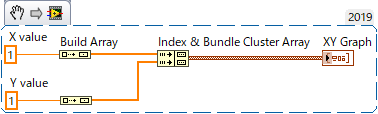 Note: This image is a LabVIEW snippet, which includes LabVIEW code that you can reuse in your project. To use a snippet, right-click the image, save it to your computer, and drag the file onto your LabVIEW diagram.
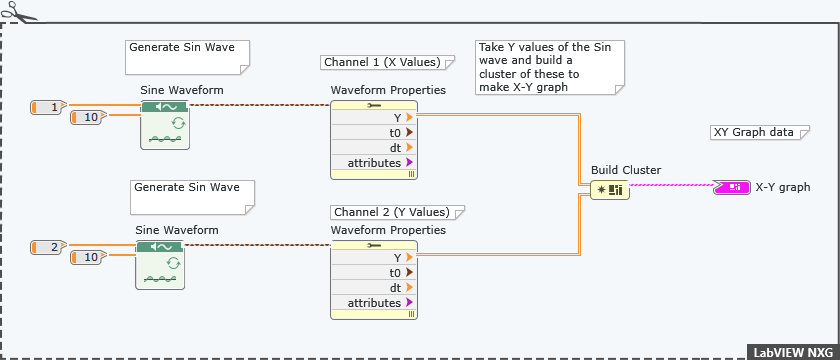
 If you want to plot two Waveform on an X-Y graph using NXG you can do it as shown in the Snippet below. First, the two Sine Waveform functions generate two Sine waves, then the Waveform properties function gets the Y values of these waves and put them in a 1 dimensional array. The build cluster function will then create a cluster of these two arrays, the first array includes the X values and the second one includes the Y values.
Note: This image is a LabVIEW snippet, which includes LabVIEW code that you can reuse in your project. To use a snippet, right-click the image, save it to your computer, and drag the file onto your LabVIEW diagram.