1. Click the Use External Debugger button in the SCRIPT panel toolbar.
2. To add a breakpoint in the SUD or DataPlugin code, you can add a
stop statement.
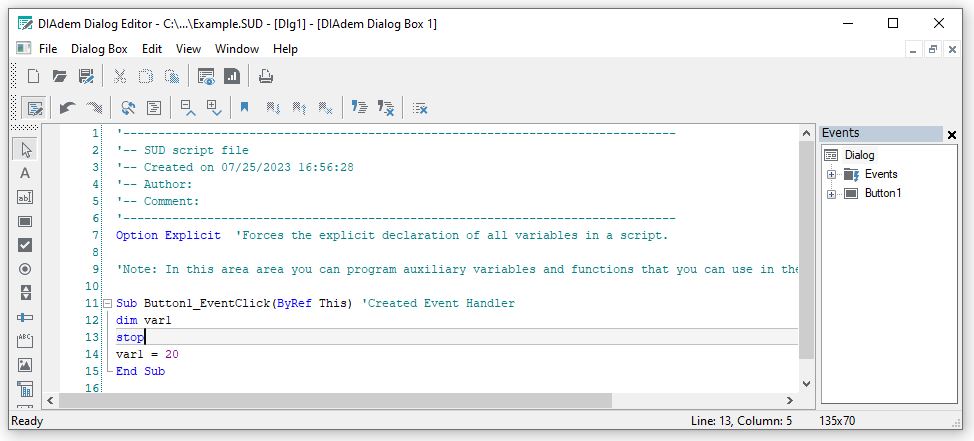
3. Click
Run Script + F5 in the DIAdem SCRIPT toolbar to run the script that is calling the SUD or DataPlugin.
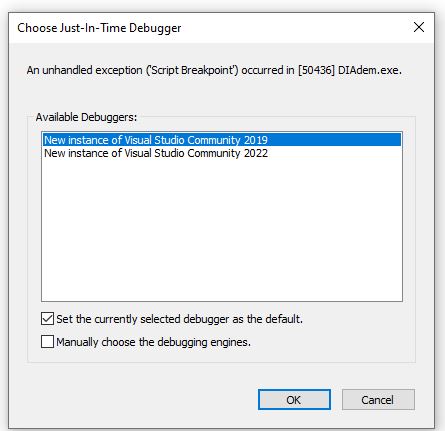
4. As soon as the script executes the stop command, the
Choose Just-In-Time Debugger dialog box opens, displaying the list of available debuggers. Select the Visual Studio version you have installed and click
OK.
5. Visual Studio opens in debug mode. You can set breakpoints, process the script step-by-step, and use other debugging functions.
6. In Visual Studio click
Stop Debugging (Shift + F5) after debugging to disconnect the debugger from the DIAdem environment.
If you do not want to select the debugger from the dialog box, you can attach the debugger to the DIAdem process before executing the script in DIAdem:
- In Microsoft Visual Studio, go to Debug>>Attach to Process...
- Attach the debugger to the DIAdem process.
- Run the script in DIAdem.
To stop using an external debugger and enable the internal debugger option again, you can click the
Use External Debugger again.
Since the
Use External Debugger option on the toolbar of DIAdem SCRIPT was added in DIAdem 2019, you will need to manually toggle the value of a Windows Registry key to be able to debug using an external debugger.
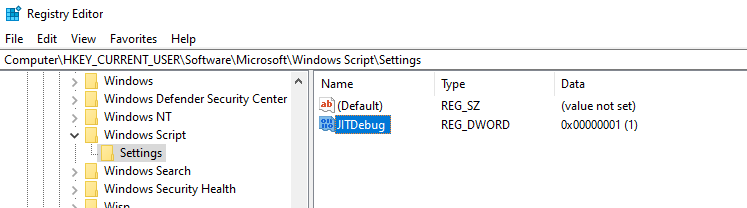
1. Open the Windows Registry.
WARNING: Inappropriate changes to the Windows Registry can cause unexpected behavior in the Operating System. To safeguard against such an event, you can backup your existing Registry by selecting File>>Export after launching the Registry Editor and before making any changes.2. Edit the
JITDebug key at
HKEY_CURRENT_USER\Software\Microsoft\Windows Script\Settings, so that it has a 1 as its value:
3. Follow the steps in the
DIAdem 2019 and newer section of this article starting with step 2.
To stop using an external debugger and enable the internal debugger option again, you will need to edit the
JITDebug key back to a value of 0.