Solution
The NI Error Reporting feature was added to NI MAX with the release of NI System Configuration 5.5. NI Error Reporting should create a .dmp file if MAX crashes. The .dmp file will be saved in
C:\User\username\Documents\LabVIEW Data\LVInternalReports\NIMAX\ and a pop-up dialog should also provide you the option to send the
.dmp file to National Instruments for evaluation.
Alternately, if you are using a version of MAX prior to 5.5, you can create a .dmp file using WinDbg. WinDbg is a tool provided by Microsoft for debugging Windows applications. It can be downloaded from
Windows Hardware Developer Central website, as part of the Debugging Tools for Windows SDK.
Follow the steps below to use the WinDbg tool:
- Install the debugging tool on the computer where you are experiencing the crash.
- Once it has finished installing, go to the Start>>All Programs>>Debugging Tools for Windows (x86)>>WinDbg to run it. On 64-bit Windows, this will be under Windows (x64).
- Once you are ready to duplicate the crash, you should attach WinDbg to Measurement & Automation Explorer by selecting File>>Open Executable....
- In the window that appears, browse to <National Instruments>\MAX\NIMAX.exe then click Open. This will open a new command window. Don't be alarmed if this window shows statements that begin with *** ERROR, this is normal.
- In the WinDbg window (not the command window), select Debug>>Go. This will launch NI MAX.
- Now that MAX is running with WinDbg monitoring it, replicate the crash. If, during replication, you encounter a status such as *BUSY*, Debuggee is running... and this status does not change for an extended period of time, click Debug>>Break.
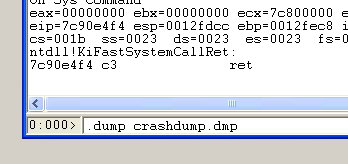
- In the WinDbg command window, type .dump <filename>.dmp. Your dump file will be saved in <Program Files>\Debugging Tools for Windows (x86). On 64-bit computers, the default dump file location is C:\WinDDK\debugger version\Debuggers\.