Solution
What is the Waveform Chart History Length? It is the number of scalar values or waveform points stored in the chart history buffer, per channel (or plot). You can change this property by right-clicking on the front panel waveform chart and selecting
Chart History Length. A dialog will appear asking for the number of data points or waveforms in chart history buffer.
Waveform Chart History for Scalar Values When a scalar value or a 1D array of scalar values is wired into a waveform chart, the
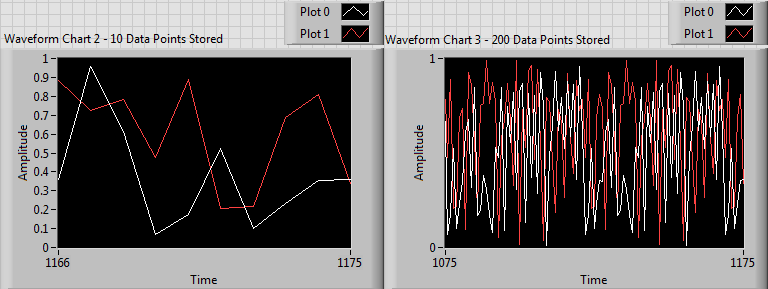
Chart History Length indicates the number of data points, per channel, that the waveform chart will store and display when running. This can be seen in the following screenshot, where two separate history lengths (10 and 200 points) are selected for the same data:
 Waveform Chart History for Waveforms
If a waveform data type is wired into a waveform chart, the
Chart History Length indicates the number of waveform points, per channel, that the waveform chart will store. The difference is that one waveform data point contains an array of y data points.
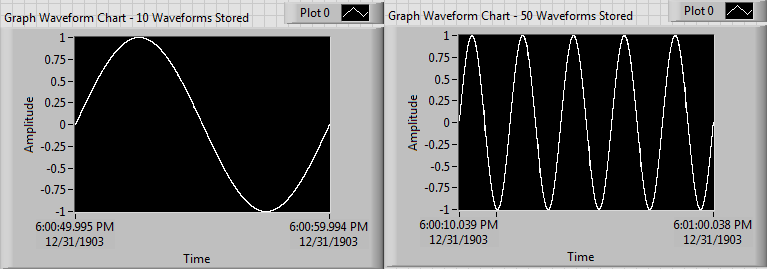
For example, by default, the Sine Waveform VI, used to create the graphs below, has an array of 1000 y data points in one waveform point. Therefore, storing 10 waveform points in the chart history will display 10000 y data points on the graph. This can be seen in the following screenshot, where two separate history lengths (10 and 50 waveform points) are selected for the same data:
 Waveform Chart History for Multiple Channels (Multiple Plots)
The waveform chart history length is
per channel. Therefore, it does not affect the display of multiple plots. For example, assume the
Chart History Length is set to 10 data points. If you plot a 2D array of scalar values representing multiple channels of data, then the waveform chart will store 10 data points for each channel (or plot), as can be seen in the first screenshot.
Seeing More Data on the Waveform Chart Than the Chart History Length DictatesIn certain situations, the waveform chart can display more data than the
Chart History Lengthdictates. This occurs when
AutoScale X is disabled and you select a range of X values that contains more points than the
Chart History Length value. The waveform chart is not removing old data points from the display, in order to adhere to the selected X range; But note, the waveform chart is still only storing the number of data points specified by the
Chart History Length.
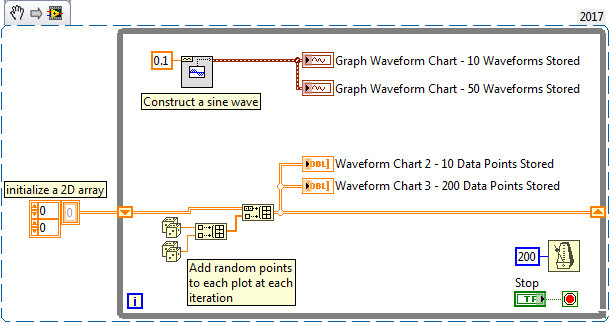
The above screenshots are from the program having block diagram as below, which consists of a simple generation of a sine wave and random numbers and plotting them on various graphs:
