Configure Waveform Chart Displaying NI-DAQmx Data to Start From Zero

Updated Apr 17, 2026

Environment

Software

  • LabVIEW

Driver

  • NI-DAQmx

  • I have am acquiring data from a DAQ device in LabVIEW. I want to plot this data on a Waveform Chart, but the X-Axis is is displaying a date or inaccurate time.
  • I want to configure a Waveform Chart to start from 0 seconds when I display data acquired via the NI-DAQmx API. How can I do this?
  • I'm acquiring a signal using the DAQ Assistant, but when I plot it on a Waveform Chart, it starts with an offset instead of starting at 0 seconds. How can I fix this?

To begin, follow these steps to configure your Waveform Chart to use Relative Time as the X-Axis display format:


  1. On the Front Panel of your VI, right-click the Waveform Chart and select Properties.
  2. In the pop-up window, select the Display Format tab.
  3. Ensure that Time (X-Axis) is selected in the drop-down menu.
  4. Click Relative Time in the Type list, and enable the HH:MM:SS format option.


  1. Click OK to save settings.

Next, follow the steps in the relevant section below, depending on whether you use the NI-DAQmx API or the DAQ Assistant.


Using NI-DAQmx API

When acquiring data using NI-DAQmx, follow the steps below to ensure that the Waveform Chart starts at 0 seconds and plots subsequent points at a relative time 0: 

    1. On the Block Diagram of the VI, ensure that the DAQmx Read VI is inside a While Loop.
      • DAQmx Read can be found within Programming >> Measurement I/O >> DAQmx - Data Acquisition in the Functions palette.
      • A While Loop can be found within Programming >> Structures in the Functions palette.
    2. Just before the While Loop starts, place a Get Date/Time In Seconds function.
      • Get Date/Time In Seconds can be found within Programming >> Timing in the Functions palette.
    3. Inside the While Loop, after the DAQmx Read, place a Get Waveform Components. Select the active item and change it to t0.
      • Get Waveform Components can be found within Programming >> Waveform in the Functions palette.
    4. Connect the waveform coming out of DAQmx Read to the input of Get Waveform Components.
    5. Place a Subtract function after the Get Waveform Components.
      • Subtract can be found within Programming >> Numeric in the Functions palette.
    6. Connect the t0 output of Get Waveform Components to the top-most input of Subtract.
    7. Connect the output of Get Date/Time in Seconds to the second input of Subtract.
    8. Place a To Time Stamp at the output of Subtract and connect them.
      • To Time Stamp can be found within Programming >> Timing of the Functions palette.
    9. Place a Build Waveform at the output of To Time Stamp.
      • Build Waveform can be found within Programming >> Waveform in the Functions palette.
    10. On Build Waveform, configure the following:
      1. The active waveform component should be t0.
      2. The top waveform input should be the waveform coming out of DAQmx Read.
    11. Connect the output of Build Waveform to your Waveform Chart Indicator.
    12. After the While Loop, ensure that you use the DAQmx Stop Task and DAQmx Clear Task VIs to properly stop and release the task.
      • Both of these DAQmx functions can be found within Programming >> Measurement I/O >> DAQmx - Data Acquisition in the Functions palette.


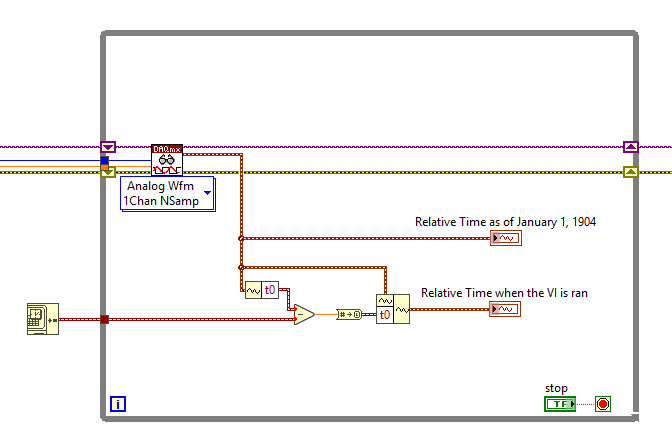
    After completing these steps, the code should resemble the following snippet.


    Note: This image is a LabVIEW snippet, which includes LabVIEW code that you can reuse in your project. To use a snippet, right-click the image, save it to your computer, and drag the file onto your LabVIEW diagram.


    Using DAQ Assistant

    If you are using the DAQ Assistant, the data format will be Dynamic Data Type. To configure the X-Axis to start at 0 seconds, follow the steps below:


    1. On the VIs's Block Diagram, ensure the DAQ Assistant is inside a While Loop.
      • The DAQ Assistant can be found within Programming >> Measurement I/O >> DAQmx - Data Acquisition in the Functions palette.
      • A While Loop can be found within Programming >> Structures in the Functions Palette.
    2. Validate that he DAQ Assistant has been properly configured for your signal and hardware.
    3. Add a Get Date/Time in Seconds just before the While Loops begins (to the left of the structure).
      • Get Date/Time In Seconds can be found within Programming >> Timing in the Functions palette.
    4. Place a From DDT on the data output of the DAQ Assistant. This is required to convert the acquired data into a waveform.
      • From DDT can be found within Programming >> Express >> Signal Manipulation.
    5. Double-click on From DDT to configure it. In the pop-up window, ensure that Single Waveform is selected as the Resulting data type. Click OK to save changes.


    1. Place a Get Waveform Components after From DDT and connect them. Change the active waveform component to t0.
      • Get Waveform Components can be found within Programming >> Waveform in the Functions palette.
    2. Connect the waveform coming out of From DDT to the input of Get Waveform Components.
    3. Place a Subtract function after the Get Waveform Components.
      • Subtract can be found within Programming >> Numeric in the Functions palette.
    4. Connect the t0 output of Get Waveform Components to the top-most input of Subtract.
    5. Connect the output of Get Date/Time in Seconds to the second input of Subtract.
    6. Place a To Time Stamp at the output of Subtract and connect them.
      • To Time Stamp can be found within Programming >> Timing of the Functions palette.
    7. Place a Build Waveform at the output of To Time Stamp.
      • Build Waveform can be found within Programming >> Waveform in the Functions palette.
    8. On Build Waveform, configure the following:
      1. The active waveform component should be t0.
      2. The top waveform input should be the waveform coming out of From DDT.
    9. Connect the output of Build Waveform to your Waveform Chart Indicator.


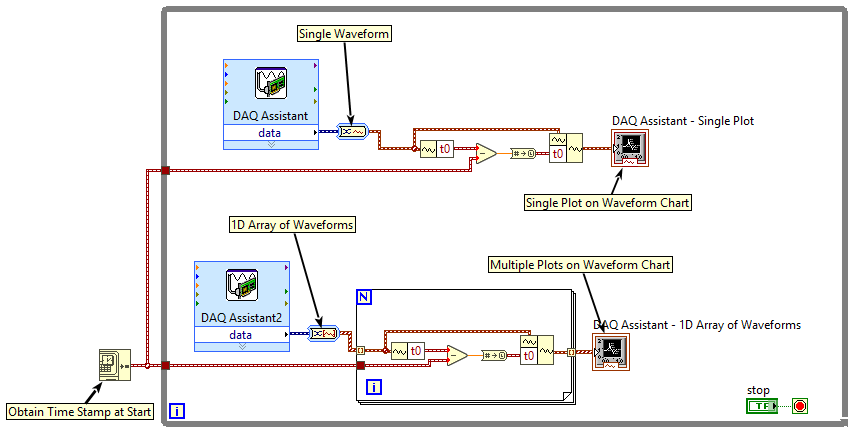
    After completing these steps, the code should resemble the following snippet.


    Note: This image is a LabVIEW snippet, which includes LabVIEW code that you can reuse in your project. To use a snippet, right-click the image, save it to your computer, and drag the file onto your LabVIEW diagram.


    Additional Information

    A waveform's timing information is taken from the system that the code is running on, which corresponds to the number of seconds that have passed since 00:00 (midnight), Friday, January 1, 1904, Universal time. LabVIEW formats this number into the current date and time.


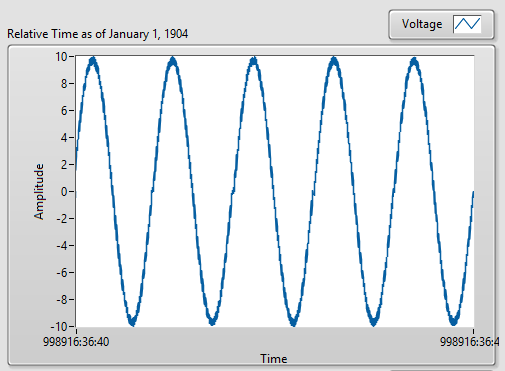
    If the current timestamp in seconds is not subtracted from the t0 component of the DAQmx waveform, the X-Axis on the Waveform Chart will appear as shown below. This is because the LabVIEW code is using 01/01/1904 as the reference starting point.

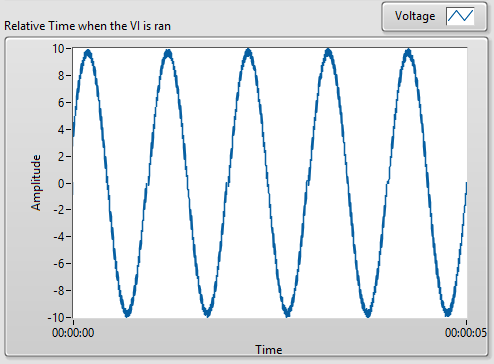
    After following the relevant section above, the X-Axis of the Waveform Chart will start from 0 and count up relatively, as shown below: