To monitor what is happening inside of the assembly while it is executing you can use the Microsoft Visual Studio IDE (Integrated Development Environment). By attaching a process to Visual Studio you can troubleshoot the application across multiple environments.
To accomplish this task, you will need:
- The source code for the assembly
- Microsoft Visual Studio
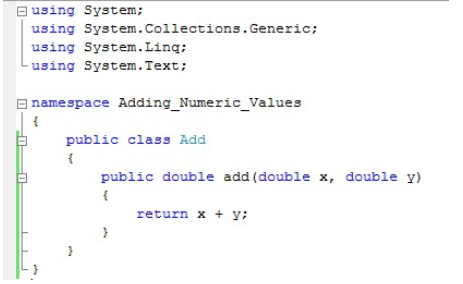
For example, consider the following assembly that adds two numbers together:
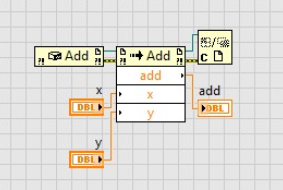
You can use the following LabVIEW code to call the assembly:
To attach to a process in Visual Studio, open the assembly source code project in Visual Studio and select
Tools»Attach Process. From the drop down list, locate the LabVIEW VI that accesses the assembly. In this example the VI is called Main.vi. The VI must be open in LabVIEW for it to appear in the list of available processes.
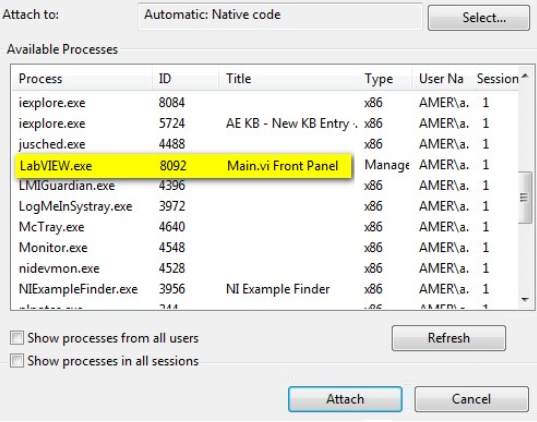
After you have located the LabVIEW process, select
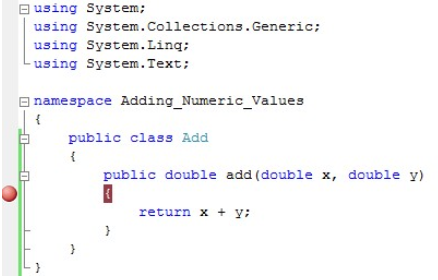
Attach.Next return to the source code and add a break point to the assembly.
 Note:
Note: The assembly is must be configured in
Debug mode.
With a breakpoint inserted and the LabVIEW process attached we can now begin debugging the assembly.
Return to LabVIEW and run the VI. The VI will operate on the assembly, and when it accesses the method Visual Studio will halt execution at the breakpoint. This will allow you to debug the assembly portion of the code from the Visual Studio IDE. Your LabVIEW VI must be pointing the the version of the DLL in the Visual Studio project directory in order to debug the code.