There are two ways you can change the color ranges, from the front panel or programmatically.
From the Front Panel:
To change the color ranges and colors from the front panel, right click on the meter and select
Marker Spacing»Arbitrary. This will show how the color ranges are broken up.
Next, move the borders of the colors by selecting a number and typing a new value for it.
To add a new color band, right click on the meter and select
Add Marker. Use the
Set Color tool from the
Tools Palette to change each individual color band.
It may be easier to select the individual color bands if you first turn off Interpolate Colors by again right clicking on the meter and ensuring
Interpolate Colors is not checked.
After all the color ranges are set up, select
Marker Spacing»Uniform to move the markers back to a uniform distribution. This will not affect the color ranges.
Programmatically:
To change the colors and color ranges programmatically, first create a property node by right-clicking on the meter on the block diagram, then selecting
Create»Property Node»Scale»Marker Values Property. The format of the data type is an array of clusters. Each cluster has a numeric value and a color in it.
If you would like to change the text and background color scale marker, select
Create»Property Node»Scale»Marker Colors on the block diagram.
To put color values into each cluster use
Color Box Constants. To create one of these constants on the block diagram, select
Functions»Numeric»Additional Numeric Constants»Color Box Constant. Then use the paintbrush tool to right-click on the constant and choose your color. A snippet is shown below.
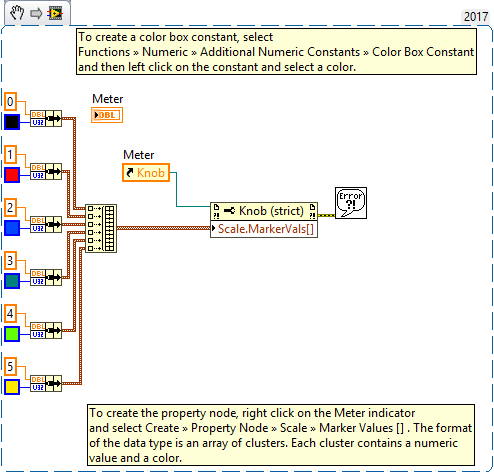
Note: This image is a LabVIEW snippet, which includes LabVIEW code that you can reuse in your project. To use a snippet, right-click the image, save it to your computer, and drag the file onto your LabVIEW diagram.