Follow the steps below to plot multiple curves graph in TestStand.
Note: Only ATML 6.01, ATML5.0, XML and HTML reports can include graphs. Check the report type on Configure >> Result Processing and ensure that Include Arrays is set to Insert Graph.
- Generate a 2D array of doubles (DBL) from a code module and pass it into TestStand. This array contains the data to be plotted.
- Any code module can be used. If using LabVIEW, refer to Plot XY Data from a 2D Array in LabVIEW.
- When using 2D arrays, data can be defined for both the X and Y axes. If a 1D array is used, the X axis will always plot the array index.
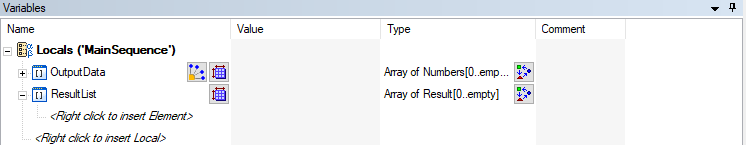
- Create a Local Variable to store the 2D array in TestStand.
- Right click on Locals from the Variables pane.
- Select Insert Local >> Array of >> Number. Save the variable as OutputData.
- At the Array Bounds window, check on Empty box.
- Add an Action Step to call your code module. Set the output variable to Locals.OutputData.
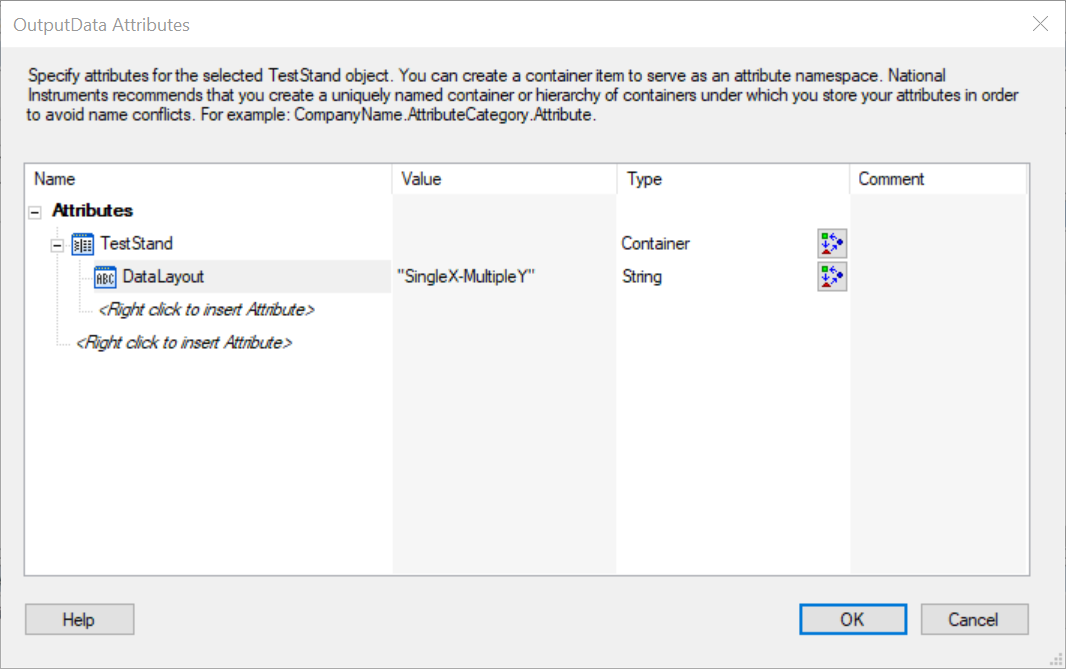
- Add a DataLayout attribute to OutputData variable. The DataLayout attribute is used to set the type of graph that will be shown in the TestStand Report.
- Right-click on OutputData >> Advanced >> Edit Attributes.
- Right click on <Right click to insert Attributes>, select Insert >> Container and name it TestStand.
- Expand TestStand attribute. Right click on <Right click to insert Attributes> under the TestStand attribute, select Insert >> String attribute and name it DataLayout. Set the value to SingleX-MultipleY.
- Optional: If plotting a 2D array, add a DataOrientation attribute to the OutputData variable.
- Right-click on OutputData >> Advanced >> Edit Attributes.
- Expand TestStand attribute. Right click on <Right click to insert Attributes> under the TestStand attribute, select Insert >> String attribute and name it DataOrientation.
- Set the DataOrientation attribute to Row Based or Column Based, depending on requirements. Refer to the table in Displaying Measurement Data as Graphs for more information.
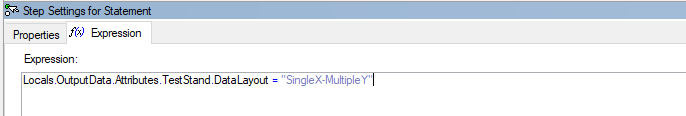
- Add a Statement Step after the Action Step. A statement similar to the following should be inserted (modify it to match the values assigned in the variable attributes):
Locals.OutputData.Attributes.TestStand.DataLayout = "SingleX-MultipleY",
Locals.OutputData.Attributes.TestStand.DataOrientation = "Column Based"
- Navigate to the Properties of the Statement and select Additional Results. Check the Output Parameter and set the Value to Log as "Locals.OutputData". Make sure Include in Report is checked.